Murrey Math Lines: USD/JPY, USD/CAD

USDJPY, “US Dollar vs. Japanese Yen”
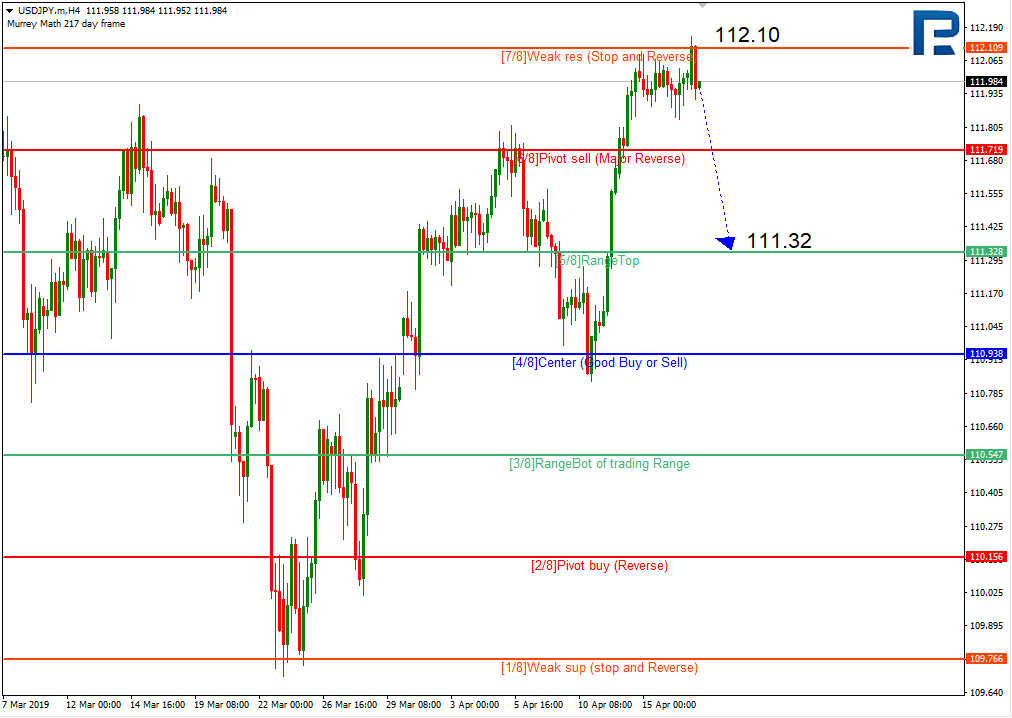
As we can see in the H4 chart, USDJPY has failed to break the resistance at the 7/8 level and may resume falling towards the support at the 5/8 one.
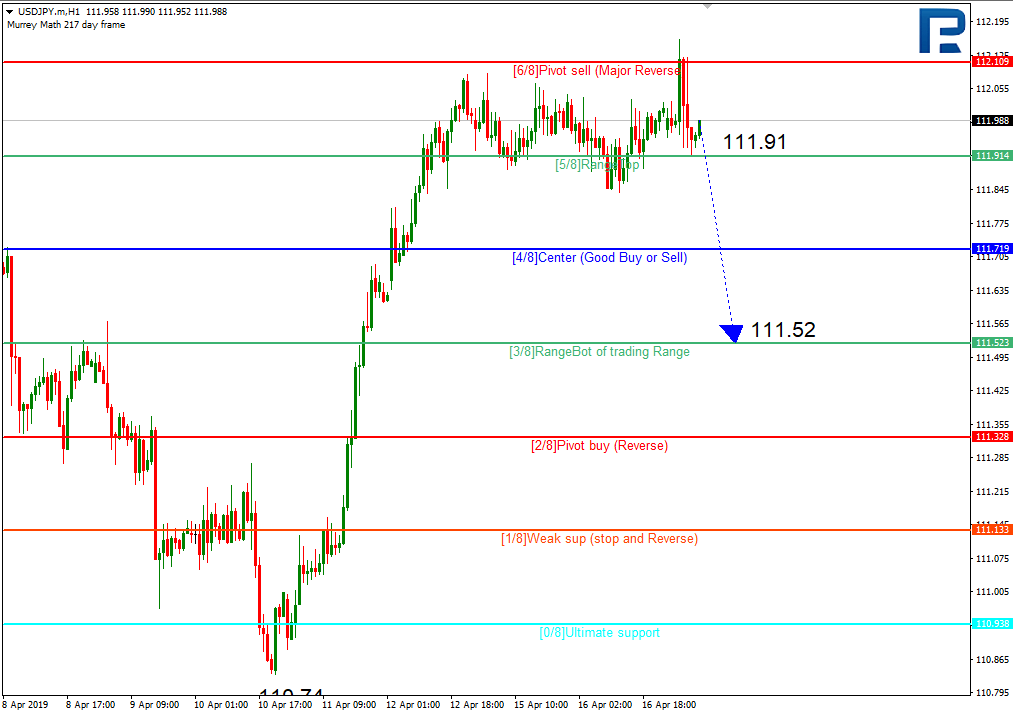
In the H1 chart, the pair may break the 5/8 level and continue falling to reach the support at the 3/8 one.
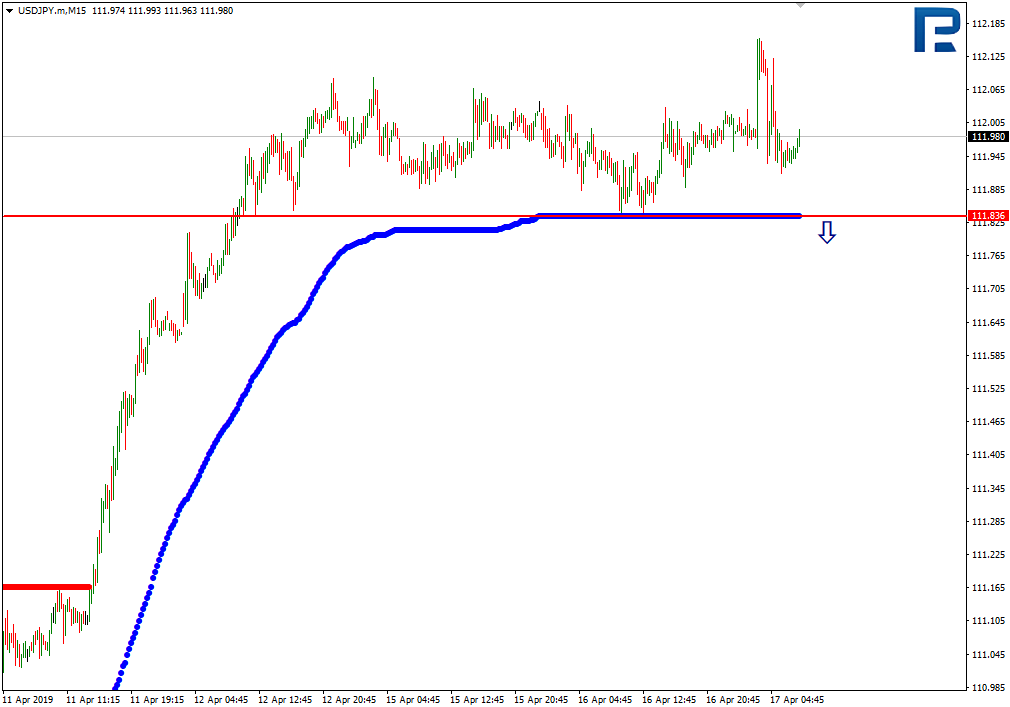
In the M15 chart, the pair may break the downside line of the VoltyChannel indicator and, as a result, continue moving downwards.
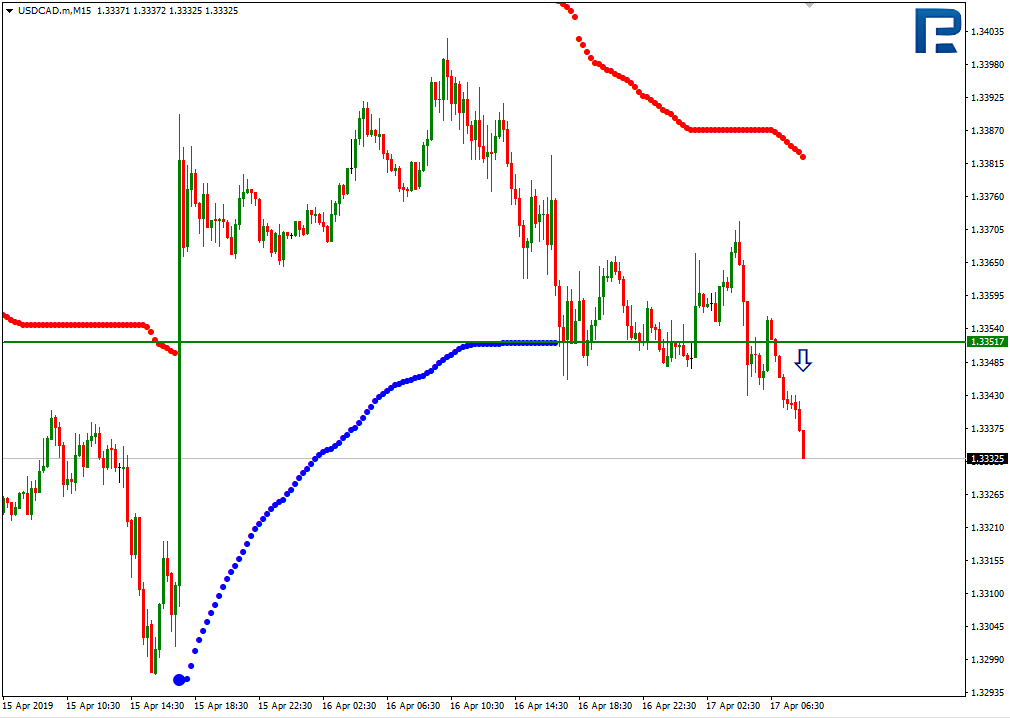
USDCAD, “US Dollar vs Canadian Dollar”
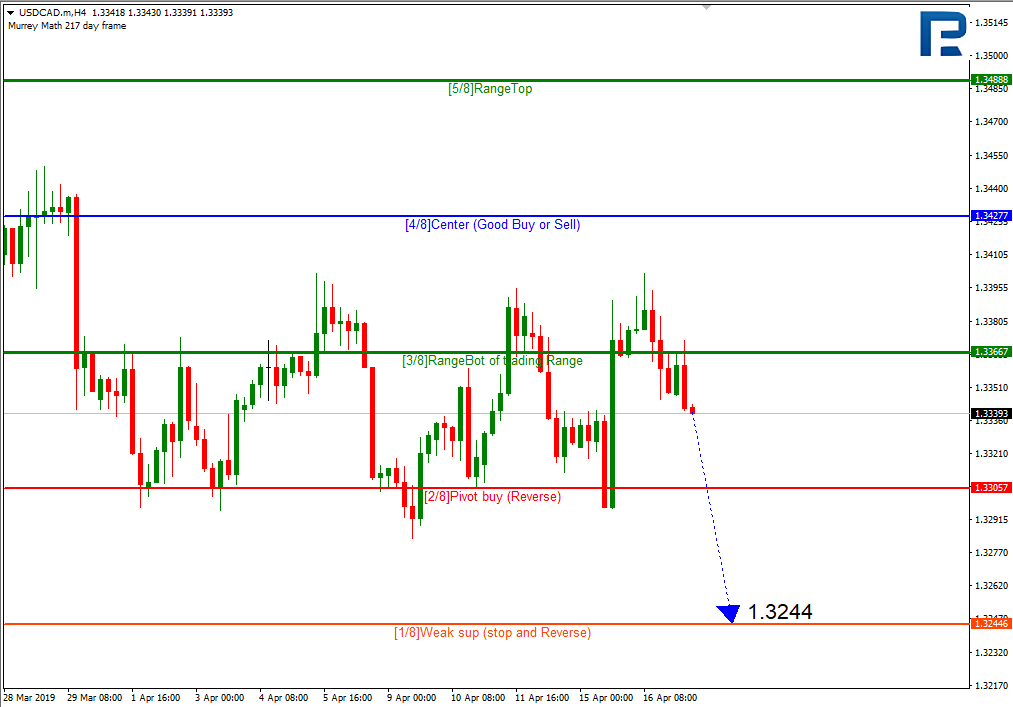
In the H4 chart, USDCAD is trading below the 3/8 level and may continue falling towards the support at the 0/8 one.
As we can see in the H1 chart, the pair has broken the 3/8 level and may continue falling to reach the support at the -1/8 one.

As we can see in the M15 chart, the pair has broken the downside line of the VoltyChannel indicator and, as a result, may continue moving downwards.
Author

RoboForex Team
RoboForex
RoboForex Team is a group of professional financial experts with high experience on financial market, whose main purpose is to provide traders with quality and up-to-date market information.


