Maybe the never-ending ES rally is tired
July 20th is an interesting date for stock indices.
I am not a believer in using astrology for market speculation, although I know it is a more popular practice than most would assume it to be. That said, in today's environment, it is fair to say fundamental analysis is meaningless and technical analysis has also seen better days. Thus, perhaps assuming a stock to respect price-to-earnings ratio or even book value is just as silly as using the stars and moon to predict the next market move. In any case, we noticed there are quite a few mentions of July 20th being some sort of significant day.
For instance, MRCI's seasonal trading signals suggest the bullish Dow trade should be offset on July 20th. But more interesting than that is an underground financial astrology guru is claiming the largest FOMO (Fear of Missing Out) rally ever seen in the stock market will begin on July 20th. Again, we are not believers in this method of analysis but this particular analyst (whose name is anonymous) was correct about the 2008 stock market slide and a few other off-the-wall calls. I know this because one of his followers was a client of ours who turned a $10,000 account into $500,000 in two weeks by purchasing deep out-of-the-money puts prior to the financial crisis. This analyst seems to believe all of the sidelined cash, particularly that of underperforming hedge funds, will chase stocks wildly higher in the coming months. I mention this because is worth noting what others are thinking and acknowledging the power of FOMO motivation.
Treasury Futures Markets

30-year Treasury Bond Futures
Treasuries are in the habit of making new highs after a pullback.
Since the bond and note market bottomed in late March of this year, we have seen the 30-year Treasuries post five thrusting new highs. Each of those new highs was followed by backing and filling action, then eventually a new high. On Monday we suspect this was another reload before a rally to new highs but today we are more confident in that prediction.
Despite the naysayers, Treasuries are consistently finding dip buyers and as long as the sentiment remains overly bearish this will likely continue. Imagine all of the speculators attempting to go short when it looks like the rally is fizzling (as they heard it would on TV or read that it would in business newspapers), then being forced to cover when prices don't collapse. Ironically, it is the bears that are adding fuel to the fire.
Similarly, the massively bearish sentiment caused portfolio managers and even mom & pop investors to be underweight Treasuries. If the stock market continues to struggle to hold recent gains, we could see money flow into Treasuries with a vengeance....we believe this is just around the corner.
Treasury futures market consensus:
We think this run will see 165'0/166'0.
Technical Support: ZB: 160'22, 159'20, 157'08, 155'19, 153'27 and 151'11 ZN: 132'26, 132'08, 131'19, 130'31 and 123'23
Technical Resistance: ZB: 164'29 and 165'20 ZN: 134'05 and 134'30
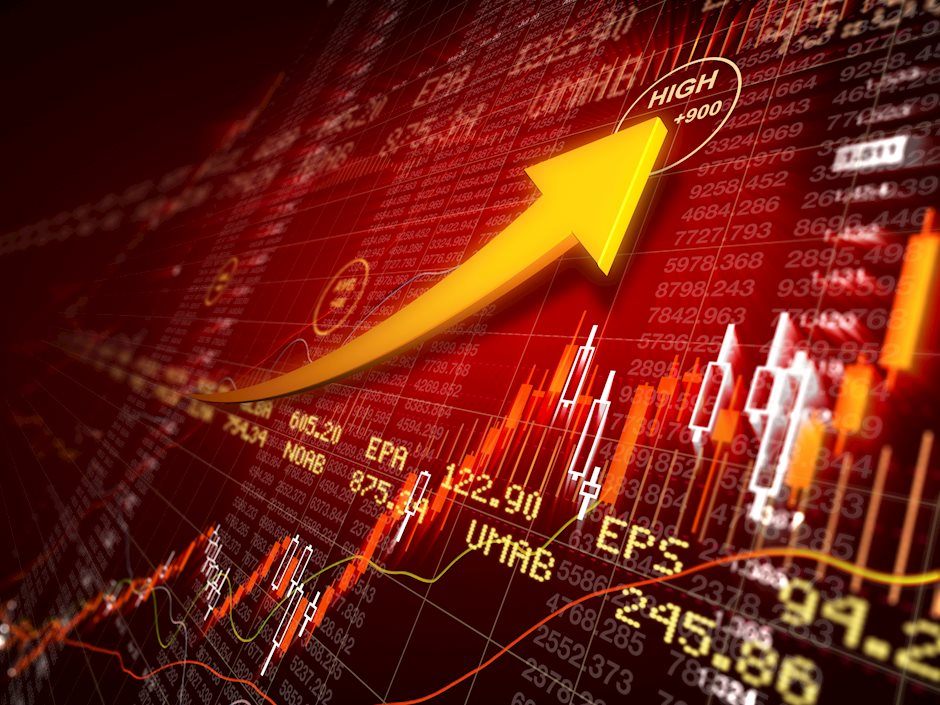
Stock Index Futures

Investors are seeking safety (Treasuries and gold). Is this telling us something?
It hasn't paid off to be a stock market bear, but to be fair, this has (arguably) been the most dramatic rally in history. It has melted through resistance levels, ignored overheated oscillators, made a mockery of finance books, and exposed the imperfections of price discovery. I will always believe markets are relatively efficient in the long run, but it is hard to argue they are in the short run. It wasn't that long ago that Tesla had a larger market cap than the next five largest car makers (think Ford, General Motors, etc.).
When investing becomes a game of price chasing without regard to logic, there is no limit to the "crazy". Nevertheless, some of the traditional signs of a looming correction are there. Will the rules of the past matter in 2021? Maybe not, but history suggests a good correction could be in the cards.
Stock index futures market consensus:
Resistance seems to have held nicely but it will take a break below 4270 to give the bears an edge.
Technical Support: 4270, 4164, 4070, 3880, 3700
Technical Resistance: 4380 and 4404
E-mini S&P Futures Day Trading Levels
*These are counter-trend entry ideas, the more distant the level the more reliable but the less likely to get filled
ES Day Trade Sell Levels: 4372, 4389 and 4404
ES Day Trade Buy Levels: 4340, 4320, 4270, 4250, 4230, 4202, 4126, 4065, and 4005
In other commodity futures and options markets...
January 4 - Go short the BCI (Bloomberg Commodity Index) near 78.6.
March 15 - Roll March BCI into June.
April 23 - Buy July wheat put spreads using the 6.75/6.25 strikes for about 17 cents.
April 28 - Buy June hog 105-100 put spread for about 1.40 in premium.
May 18 - Buy August natural gas 2.75 puts.
May 24 - Offset long wheat put spread to lock in gain.
June 15 - Roll BCI into September.
June 18 - Buy the September 13.20 call, sell the 14.20 call and the 15.20 call (ladder).
June 21 - September wheat ladders (buy the 6.75 call, sell the 7.25 call and the 7.60 call to finance the long 6.75.
June 23 - September crude oil butterflies, buy the September 70 put, sell 2 65 puts, and buy the 60 put.
June 30 - December corn bullish call ladders using the 5.50/6.50/7.00 strikes (low-cost trade with little downside risk).
July 7 - Buy 1 September 30-year 164 call, sell 1 167 call, and sell a 170 call for a net cost of 32 ticks.
Author

Carley Garner
DeCarley Trading
Carley Garner is an experienced commodity broker with DeCarley Trading, a division of Zaner, in Las Vegas, Nevada. She is also the author of multiple books including, “Higher Probability Commodity Trading” and “A Trader's First Book on Commodities”.


