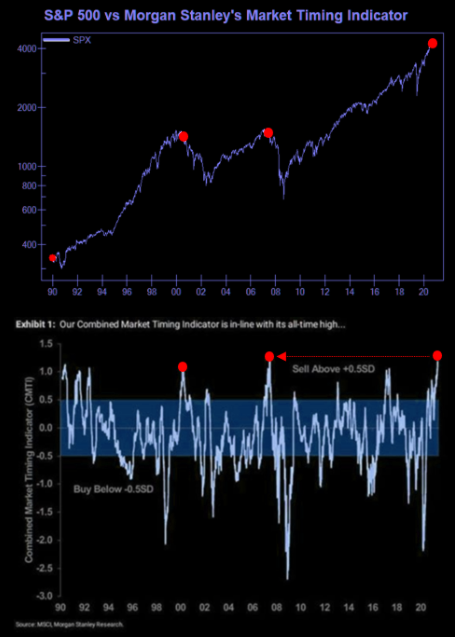
Morga stanley market timing indicator

The Morgan Stanley Market Timing Indicator has reached the most bearish reading on record.

fxsoriginal

Copper futures daily

Chart

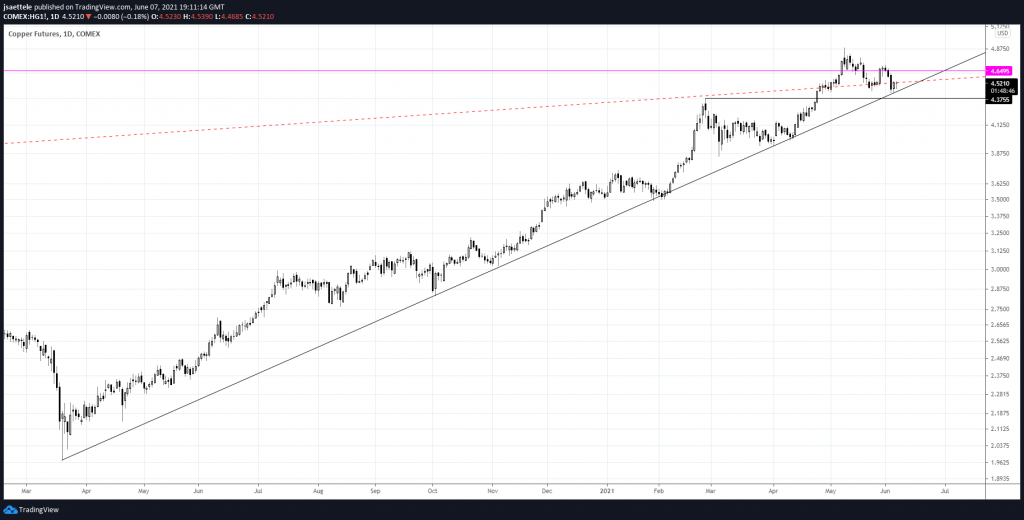
Copper is at 14+ month trendline support.  A break below would indicate a significant behavior change and usher in the largest decline since the rally started in March 2020.  The long term picture is below.

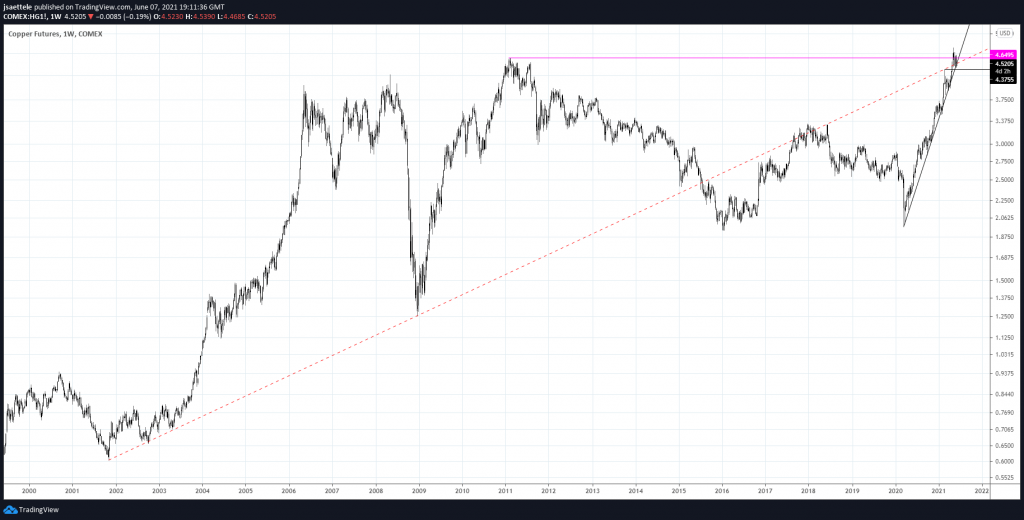
5/24 – After trading to an all time high 2 weeks ago, copper put in a weekly reversal candle.  Price followed through on the downside last week as well.  This raises the specter of a massive failure after the move above the 2011 high.  A close up view is below.

Copper futures weekly

Copper

USDollar 4 hour

USDollar

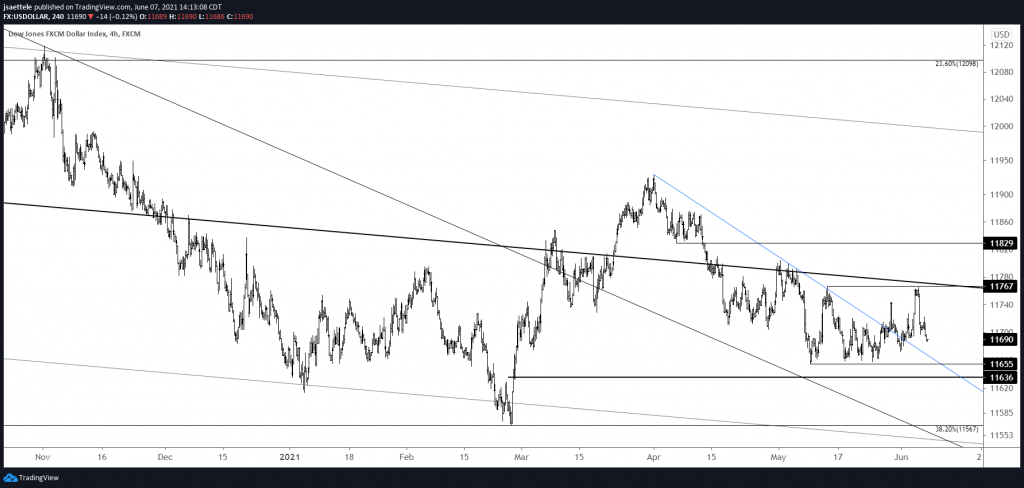
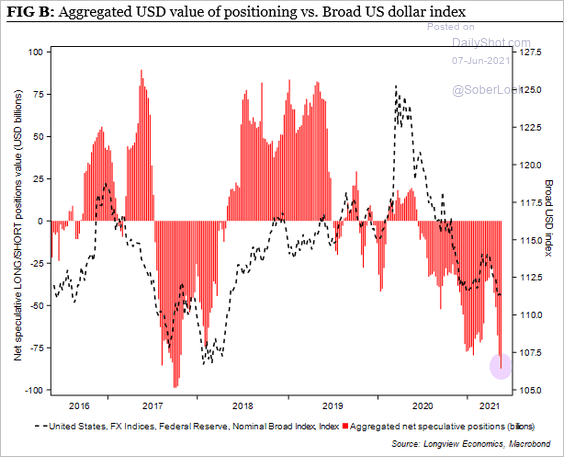
USDOLLAR traded into the upside level of interest and turned sharply lower.  Most of the rally from the May low has been retraced.  Even so, nothing regarding the idea of a massive consolidation bottom since January has changed.  11655 remains proposed support.  COT positioning is stretched to the downside and indicates elevated reversal risk (see below).

6/2 – Like Friday, USDOLLAR tried breaking out today.  Also like Friday, price was slammed lower as U.S. trading got under way.  Still, price has broken above the trendline from the April high so maybe the buck finally ‘surprises’ to the upside.  If it does, then the next level of upside interest is 11770.

USD positioning (COT)

fxsoriginal

USD/CNH weekly

USDCNH

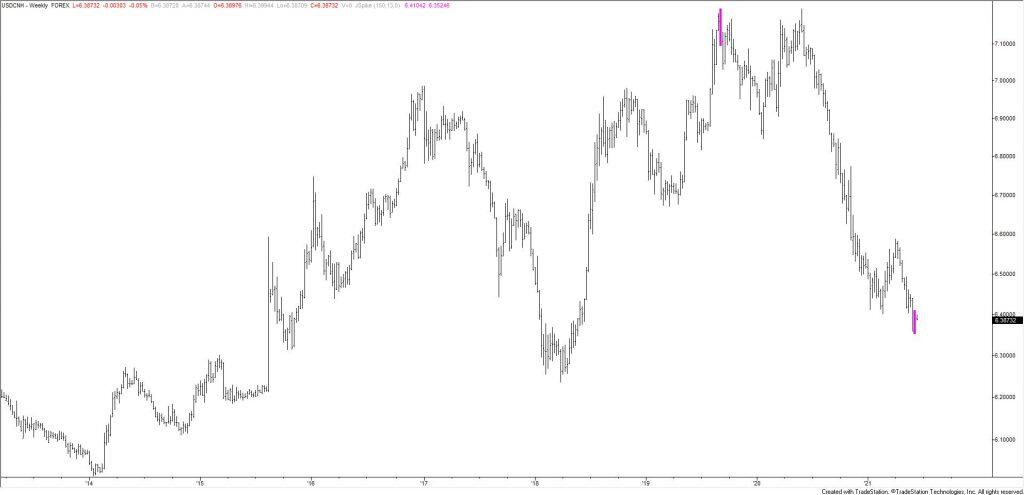
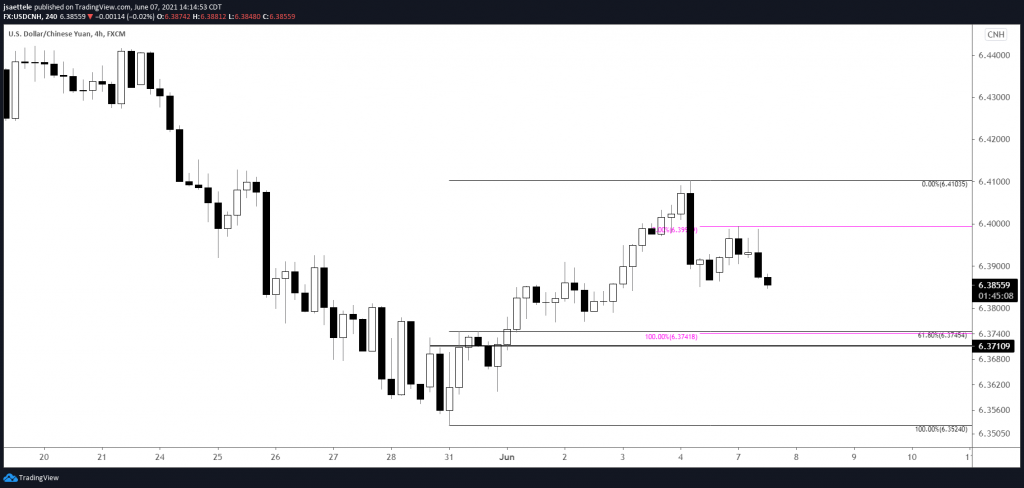
USDCNH made a weekly J-Spike last week.  This is the 2nd signal since 2013 when price is at a 3 year extreme (high/low).  The only other signal was the bearish one in September 2019…which nailed the top.  Near term, watch for 6.3740s support (see below).

USD/CNH 4 hour

USDCNH

USD/JPY 4 hour

USDJPY

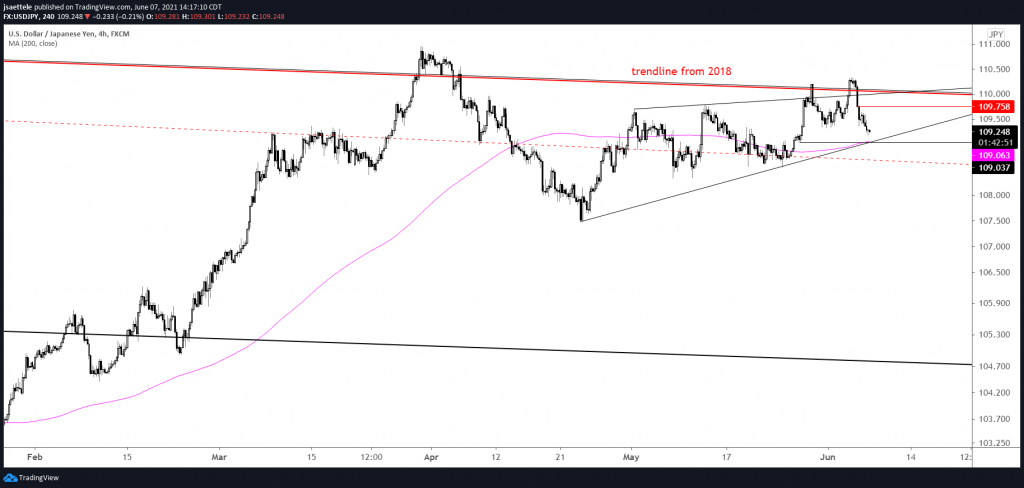
USDJPY failed at the line off of the 2018 and 2020 highs again last week.  A break below 109.00 would suggest that a top is in place.  Proposed resistance is the high volume level from NFP at 109.75.

EUR/JPY daily

EURJPY

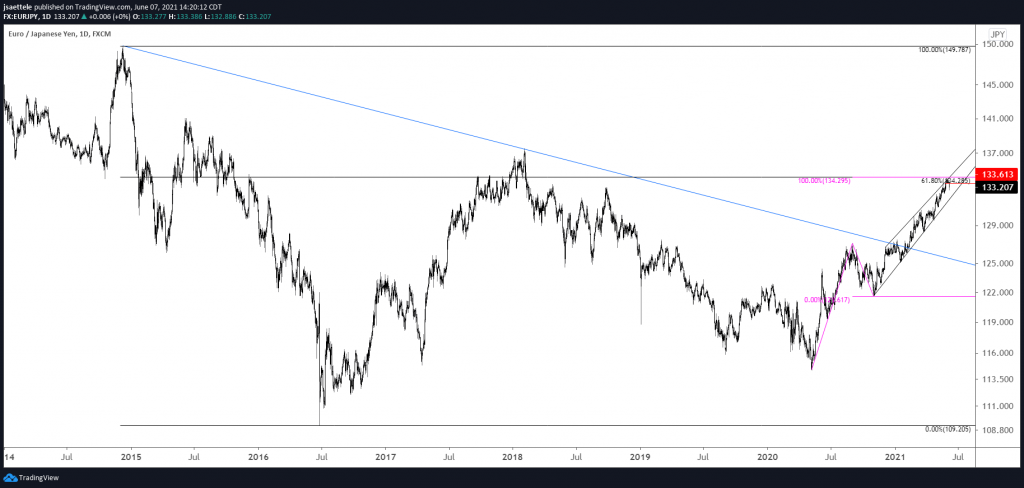
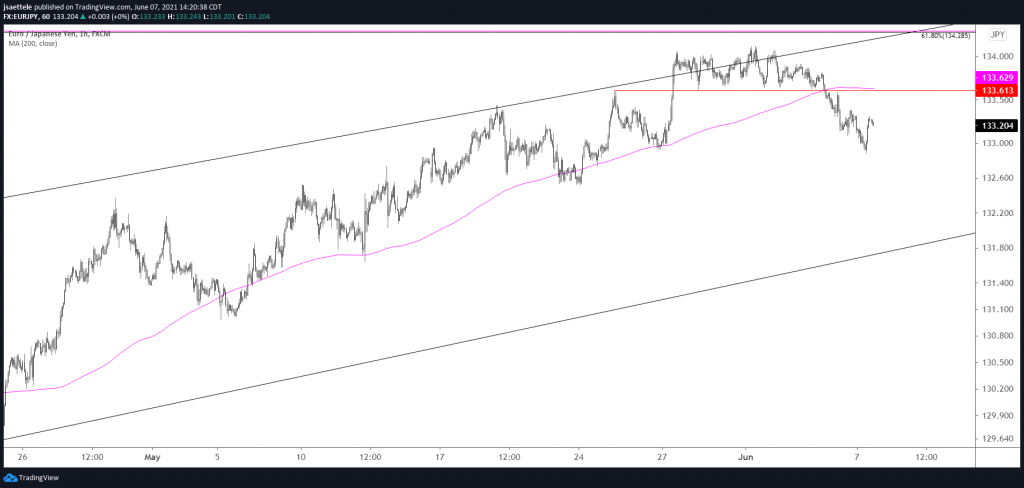
EURJPY has turned down just ahead of the noted 134.30.  The lower wedge line is about 132.00 but 133.60 should provide resistance if a top is in place.  This level is defined by the 200 hour average and a well-defined horizontal pivot (see below).

5/20 – EURJPY action since the October low has taken the form of a wedge.  The rally stalled this week after taking out the September 2018 high but I’m wondering if we get a final spike into 134.30, which is both the 61.8% retrace of the decline from the 2014 high and 2 equal legs up from the 2020 low.  A close-up view is below.

EUR/JPY hourly

EURJPY

Any reviews, news, research, analysis, prices or other information contained in this article is provided as general market commentary, does not constitute investment advice and may undergo changes from time to time. Trading the Financial and Currency Markets on margin carries a high level of risk and may not be suitable for all investors. The high degree of leverage can work against you as well as to your favor. Before entering trading Financial and Currency Markets, you should carefully consider your investment objectives, level of experience and risk appetite. There is a possibility that you could sustain a loss of some or more of your initial investment and therefore you should not invest money which you cannot afford to lose. You should be aware of all the risks associated with Financial and Currency Markets trading, and in case you have any doubt, rather seek advice from an independent financial advisor. Scandinavian Capital Markets AB, its owners, employees, agents or affiliates do not give investment advice, therefore Scandinavian Capital Markets AB assumes no liability for any loss or damage, including without limitation to, any loss of profit, which may be suffered directly or indirectly from use of or reliance on such information. Scandinavian Capital Markets AB strongly encourages consultation with a licensed representative or financial advisor regarding any particular investment or use of any investment strategy.

Recommended Content


Recommended Content

Editors’ Picks

EUR/USD edges lower toward 1.0700 post-US PCE

EUR/USD edges lower toward 1.0700 post-US PCE

EUR/USD stays under modest bearish pressure but manages to hold above 1.0700 in the American session on Friday. The US Dollar (USD) gathers strength against its rivals after the stronger-than-forecast PCE inflation data, not allowing the pair to gain traction.

EUR/USD News

GBP/USD retreats to 1.2500 on renewed USD strength

GBP/USD retreats to 1.2500 on renewed USD strength

GBP/USD lost its traction and turned negative on the day near 1.2500. Following the stronger-than-expected PCE inflation readings from the US, the USD stays resilient and makes it difficult for the pair to gather recovery momentum.

GBP/USD News

Gold struggles to hold above $2,350 following US inflation

Gold struggles to hold above $2,350 following US inflation

Gold turned south and declined toward $2,340, erasing a large portion of its daily gains, as the USD benefited from PCE inflation data. The benchmark 10-year US yield, however, stays in negative territory and helps XAU/USD limit its losses. 

Gold News

Bitcoin Weekly Forecast: BTC’s next breakout could propel it to $80,000 Premium

Bitcoin Weekly Forecast: BTC’s next breakout could propel it to $80,000

Bitcoin’s recent price consolidation could be nearing its end as technical indicators and on-chain metrics suggest a potential upward breakout. However, this move would not be straightforward and could punish impatient investors. 

Read more

Week ahead – Hawkish risk as Fed and NFP on tap, Eurozone data eyed too

Week ahead – Hawkish risk as Fed and NFP on tap, Eurozone data eyed too

Fed meets on Wednesday as US inflation stays elevated. Will Friday’s jobs report bring relief or more angst for the markets? Eurozone flash GDP and CPI numbers in focus for the Euro.

Read more

Majors

Cryptocurrencies

Signatures