Market turning point

Current Position of the Market
SPX Long-term trend: There is some evidence that we are still in the bull market which started in 2009 and which could continue until major cycles take over, and it ends. The 4550 projection which had been in effect since the March 2020 low has now been reached, but there is still no sign of a major top.
SPX Intermediate trend: A Short-term SPX correction is underway.
Analysis of the short-term trend is done daily with the help of hourly charts. They are important adjuncts to the analysis of daily and weekly charts which determine longer market trends.
Focus on the Short-term Cycle
Cycles: Looking ahead!
7-yr cycle – Last lows: 2009-2016. Next low: ~2023
Market Analysis (Charts, courtesy of StockCharts)
DJA daily
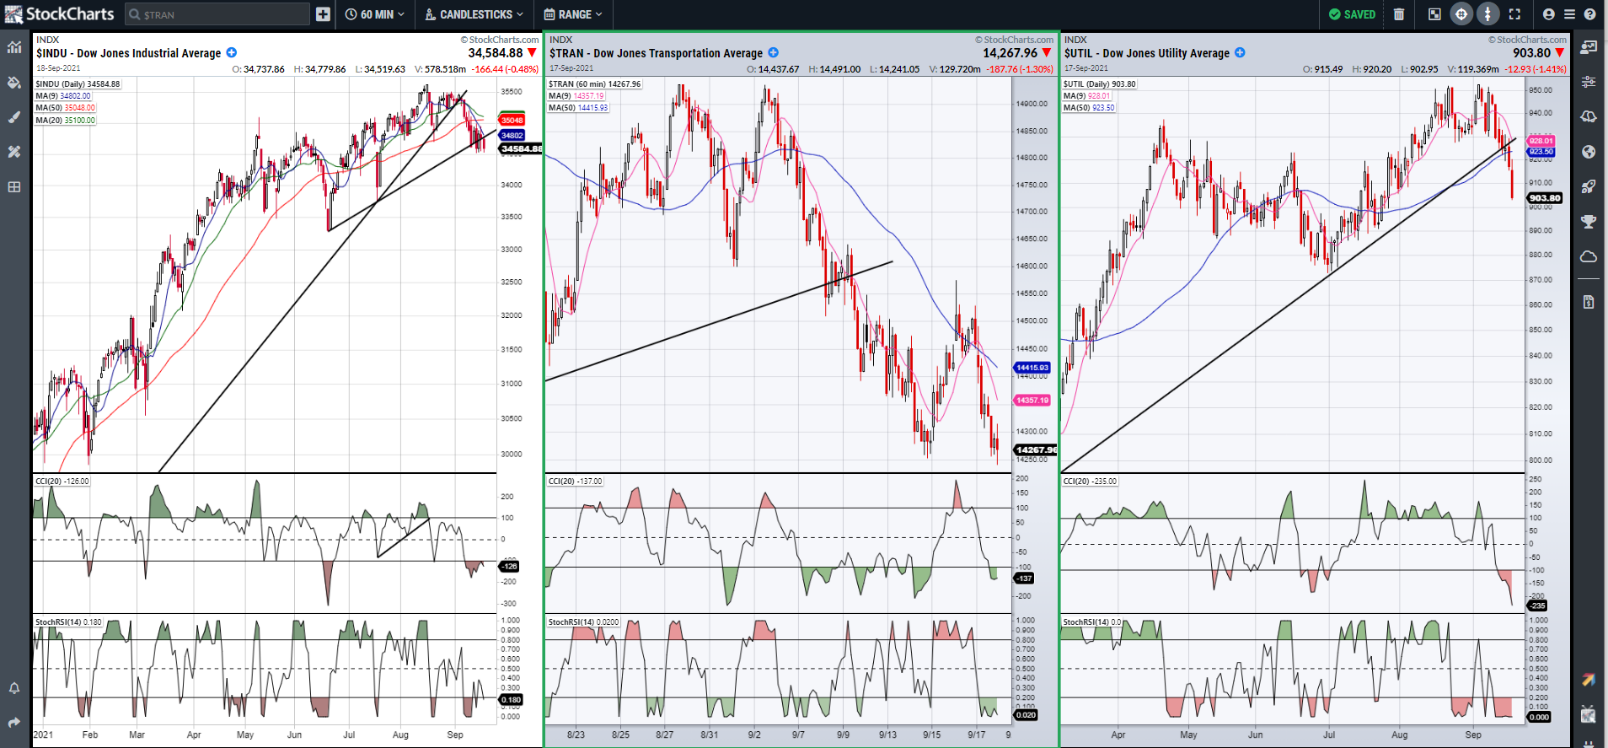
Here is another perspective on the market: while the SPX and NDX have continued to make new highs, the Dow Jones complex (industrials, Transports, utilities) has been going sideways since May. Is it simply consolidating at the intermediate level, or making a major top? This is not a question that can be answered at this time, but if this index makes a new low, we may have our answer.
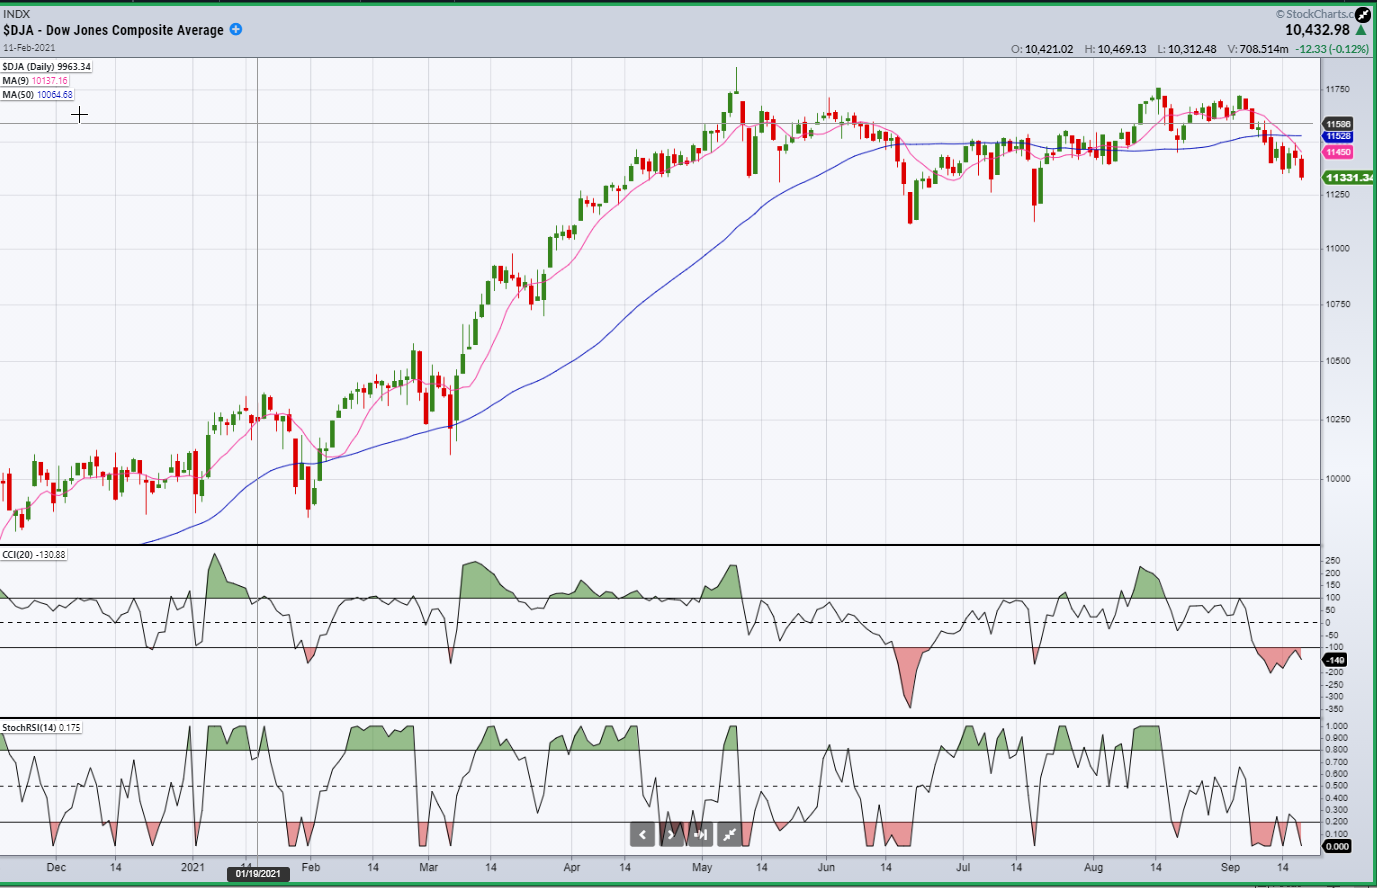
The individual components are charted separately below. The transportation index, which has been severely affected by the pandemic has been the weak sister, but the other two may be showing an inclination to follow it. The TRAN is already making new lows, a response to a resurgence of virus infections, while the UTIL is becoming concerned with a possible recurrence of inflation. The latter is also affecting the INDU.
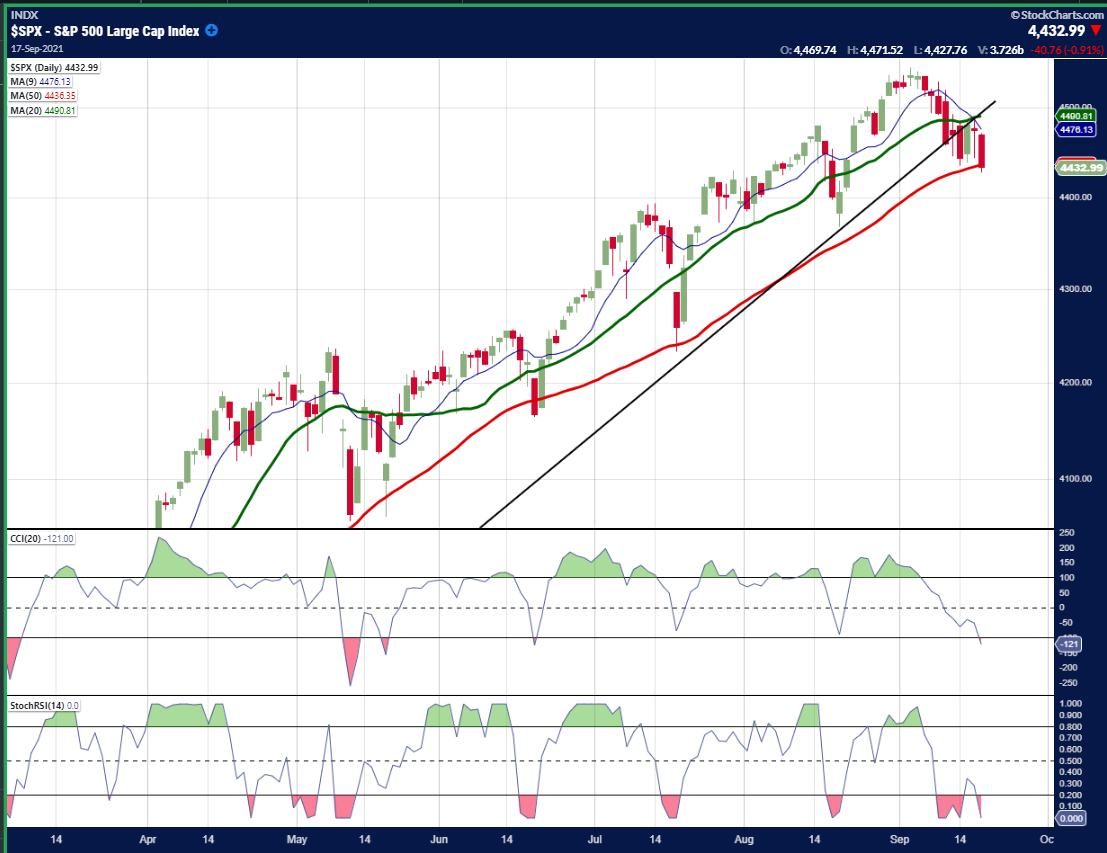
SPX daily chart
In the previous report I mentioned that the short-term cycle – probably an expression of the Hurst 80-day cycle – which had been beating visibly and regularly on the daily SPX chart was likely to have its weakest showing since May. This was confirmed last week since it has already made the more complex correction from that date and probably has a couple more days to go which, according to the SPX P&F chart, could extend the decline down to ~4380.
If so, this pullback would already give us the largest correction since May. But if the next short-term cycle fails to make a new all-time high, we would then be liable to make a correction which is at least as important as that made from September to November of last year; and that could set up the index for a final run into a major high which could become unchallenged until after the 7-year cycle has made its low.
In the last letter, I suggested that following the gyrations of the short-term cycle could be as good an analytic strategy as any to determine how much weakness lies ahead. If you look at the chart below you will note that since last May the short-term cycle exhibited a right-translation pattern, until the current one when the cycle top occurred precisely halfway through its span. That was a warning that the next short-term correction would be longer and probably deeper than anything since May. In addition, if we do have more downside directly ahead, it will be the first time since March that SPX has been able to trade below its 50-dma!
Does this mean that the bullish trend which started in March 2020 is starting to weaken; that an important shift is taking place in the buying/selling ratio? Yes, but we still do not know for how long and to what degree. It will take a little longer before we know if this will lead to the end of the bull market, or simply to one more intermediate consolidation/correction before the final top.
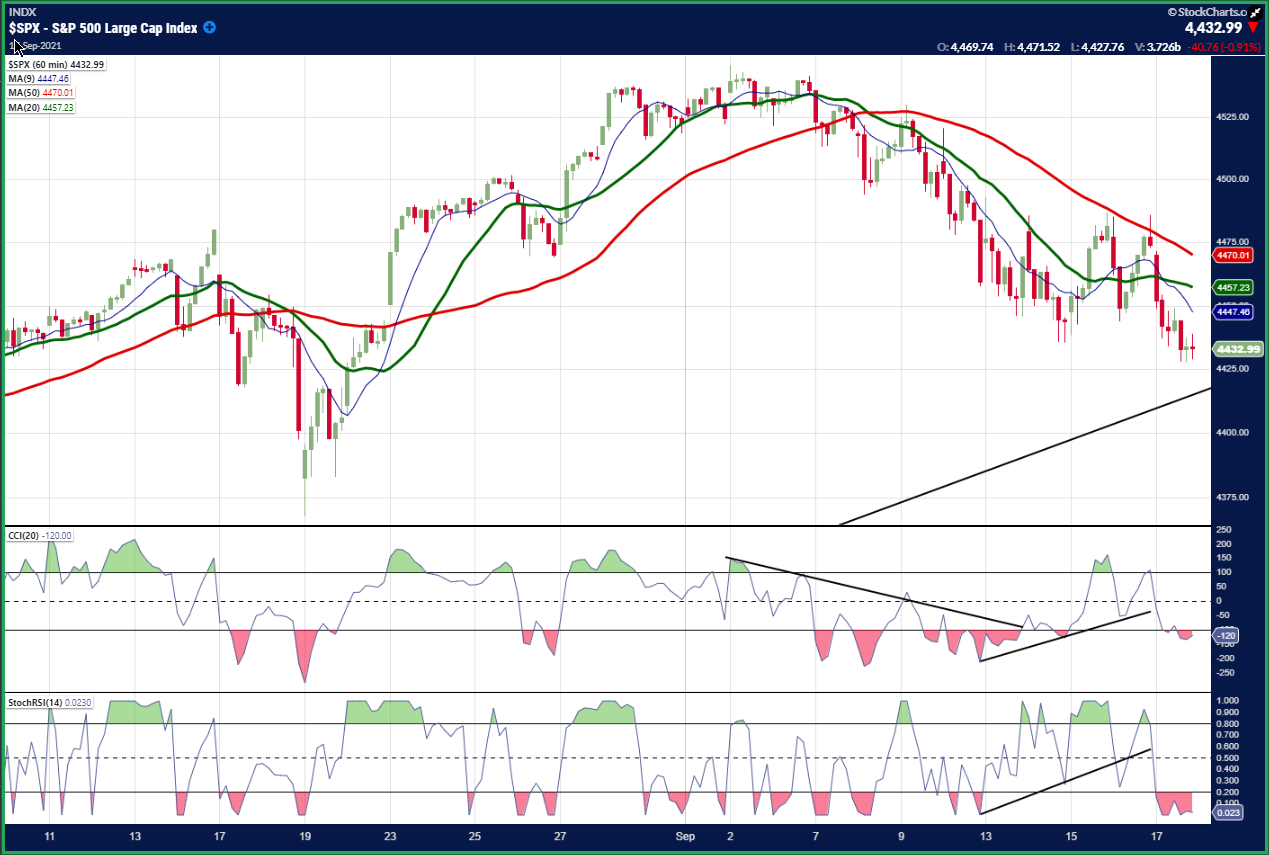
SPX hourly chart
Once again, the 60-m chart below encompasses the full span of the short-term cycle to date, and it is deemed to continue for another 1-3 days before it is complete. As stated in last week’s letter, the time when the short-term cycle will be able to extend the end of its phase below its beginning price will be significant since it could be tantamount to the first time since March 2020 that a short-term low was exceeded on the downside. The most basic definition of an uptrend is that it consists of a series of higher highs and higher lows. When that pattern is broken by a lower high followed by a lower low, the trend is considered to have reversed.
The current cycle has taken SPX to the new all-time high of 4546, and it is unlikely that the current cycle low will exceed its current beginning phase low of 4368. We can therefore conclude that, at this time, there is no immediate threat of the bull market topping out; but, as we know, the longest journey begins with a small step! Consequently, we’ll see if the next short-term cycle -- probably due to make its appearance next week -- will turn out to be the next step!
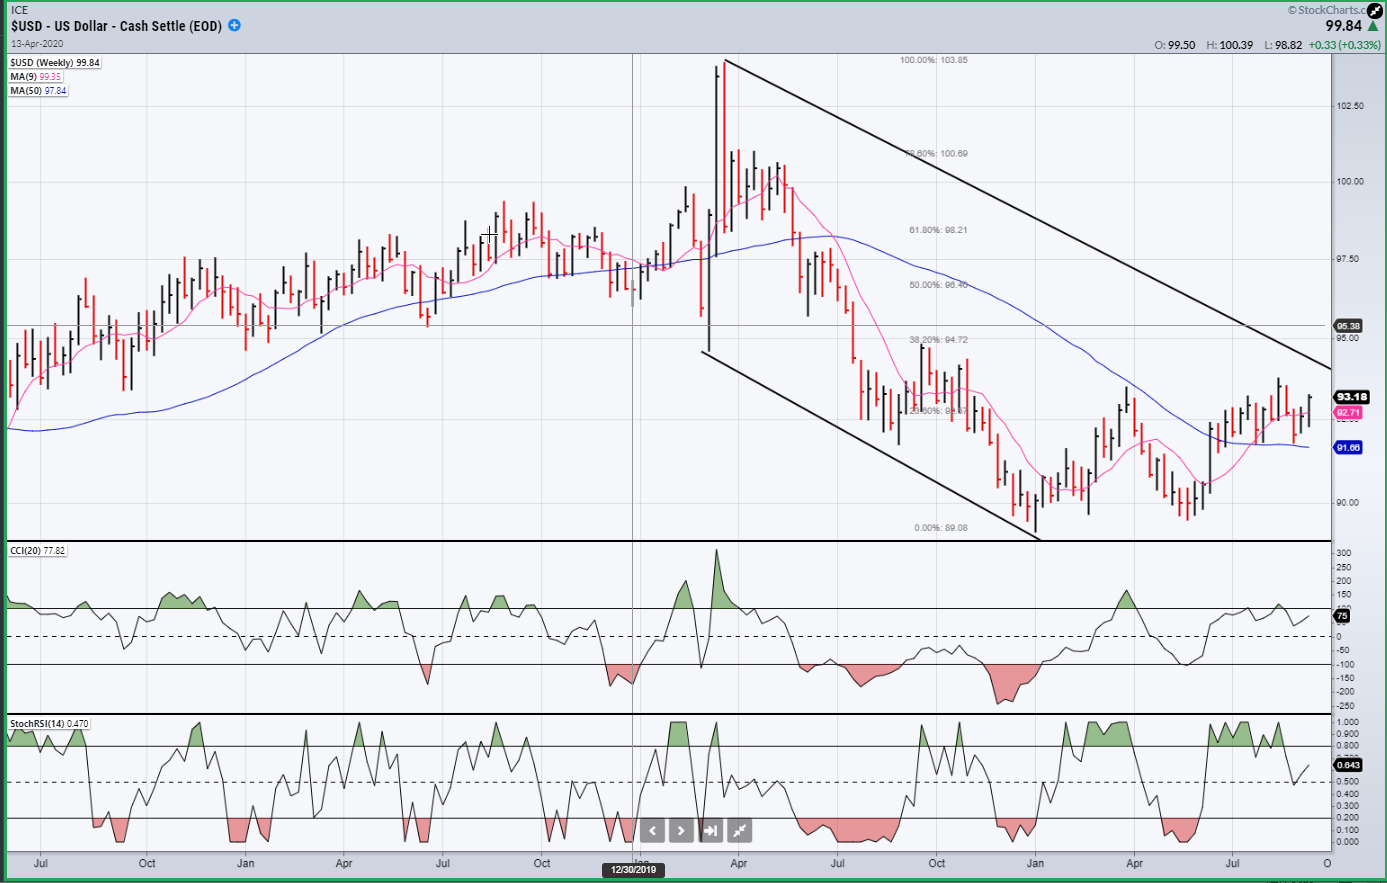
USD (dollar) dly
The dollar briefly retraced its uptrend but found support on the 50-dma and is attempting to resume it. It’s not certain that the correction is over, and it will take a few more days before this is confirmed.
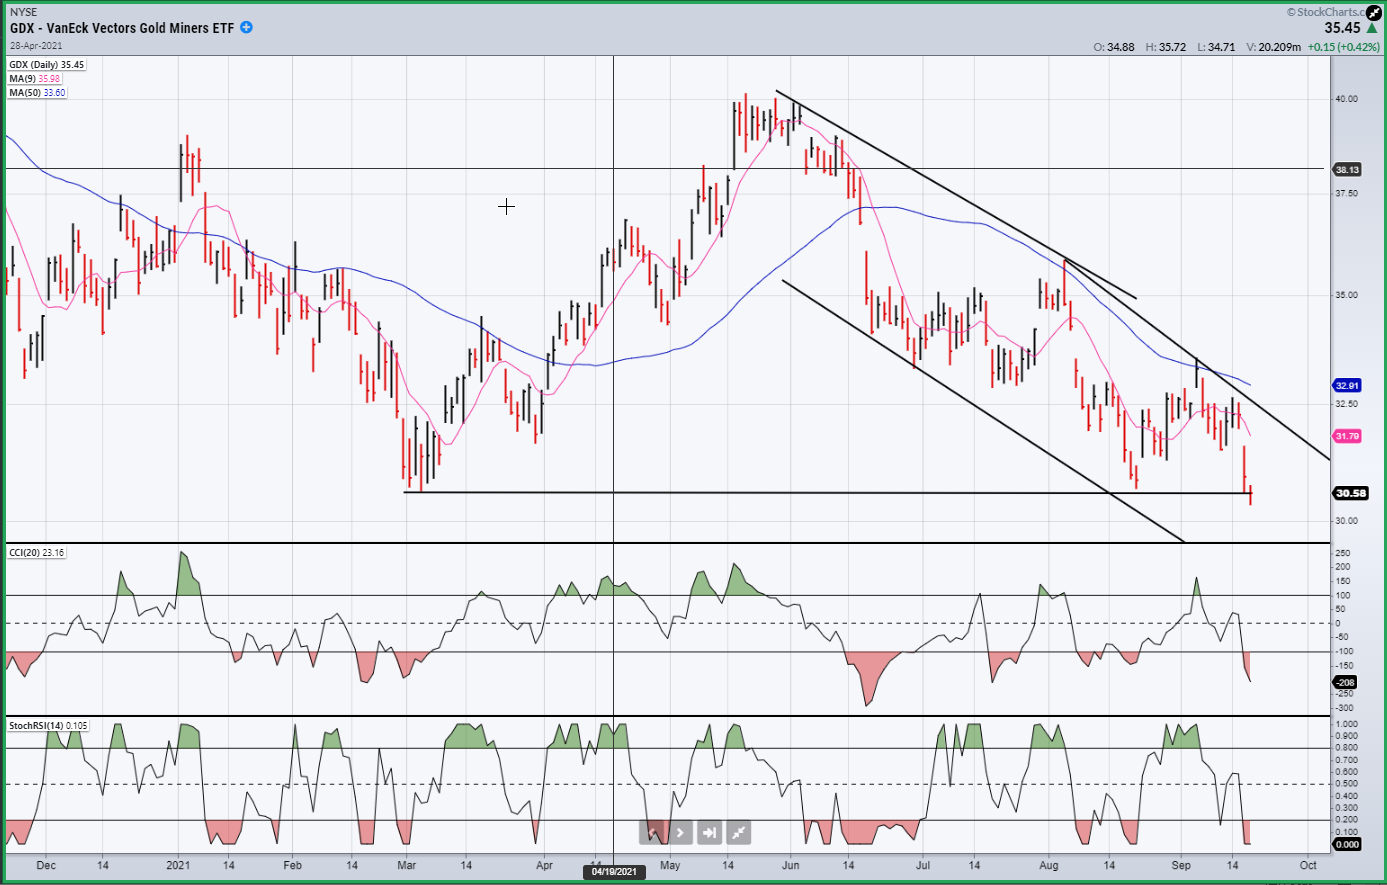
GDX (gold miners) (dly)
GDX may be resuming its downtrend. It failed to make a new high and quickly sold off to a new low. Should it fail to find support quickly, the next target would be 28.50-29.00.
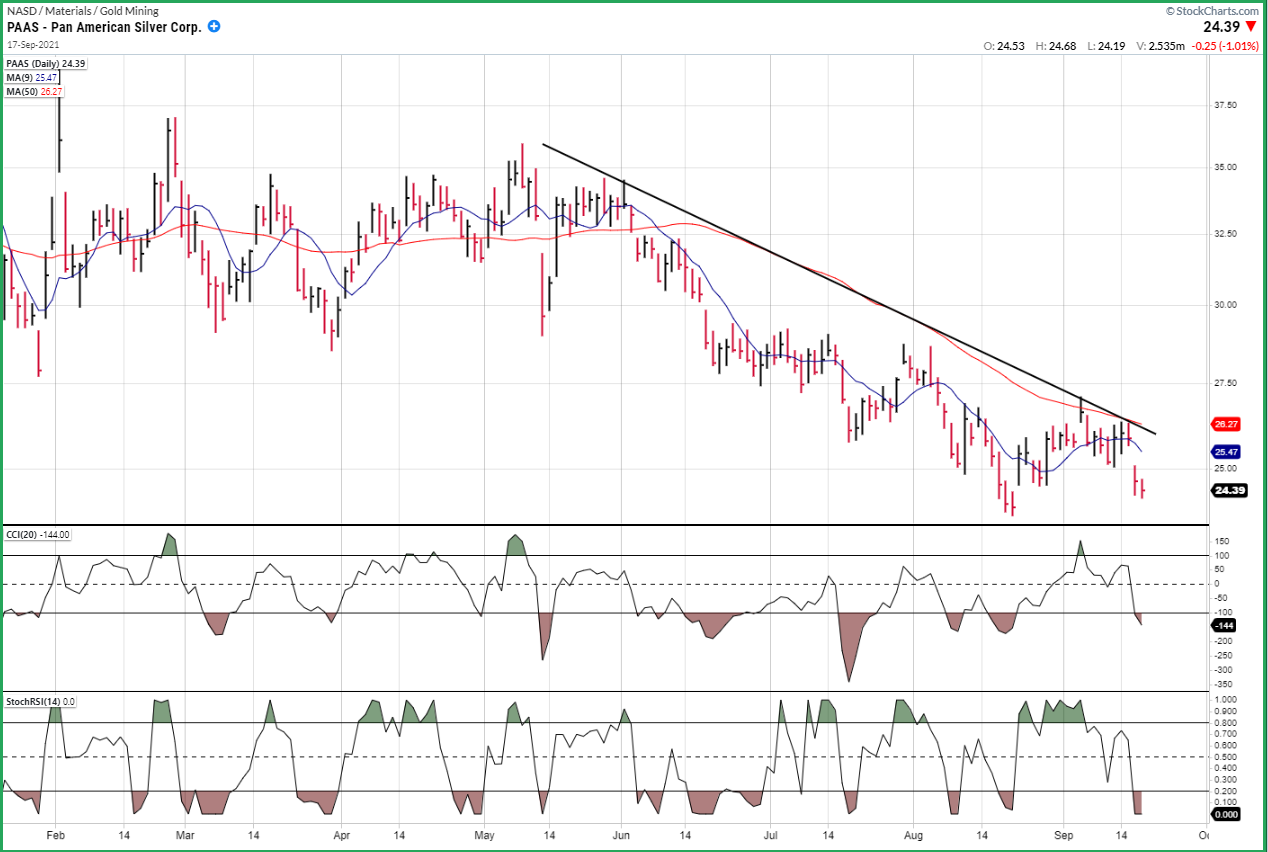
PAAS (dly)
PAAS has also sold off after failing to overcome its downtrend line and the 200-dma combined. It has not yet made a new low and we’ll have to see if there is some follow through to the selling. A move above the trend line would be an important bullish statement.
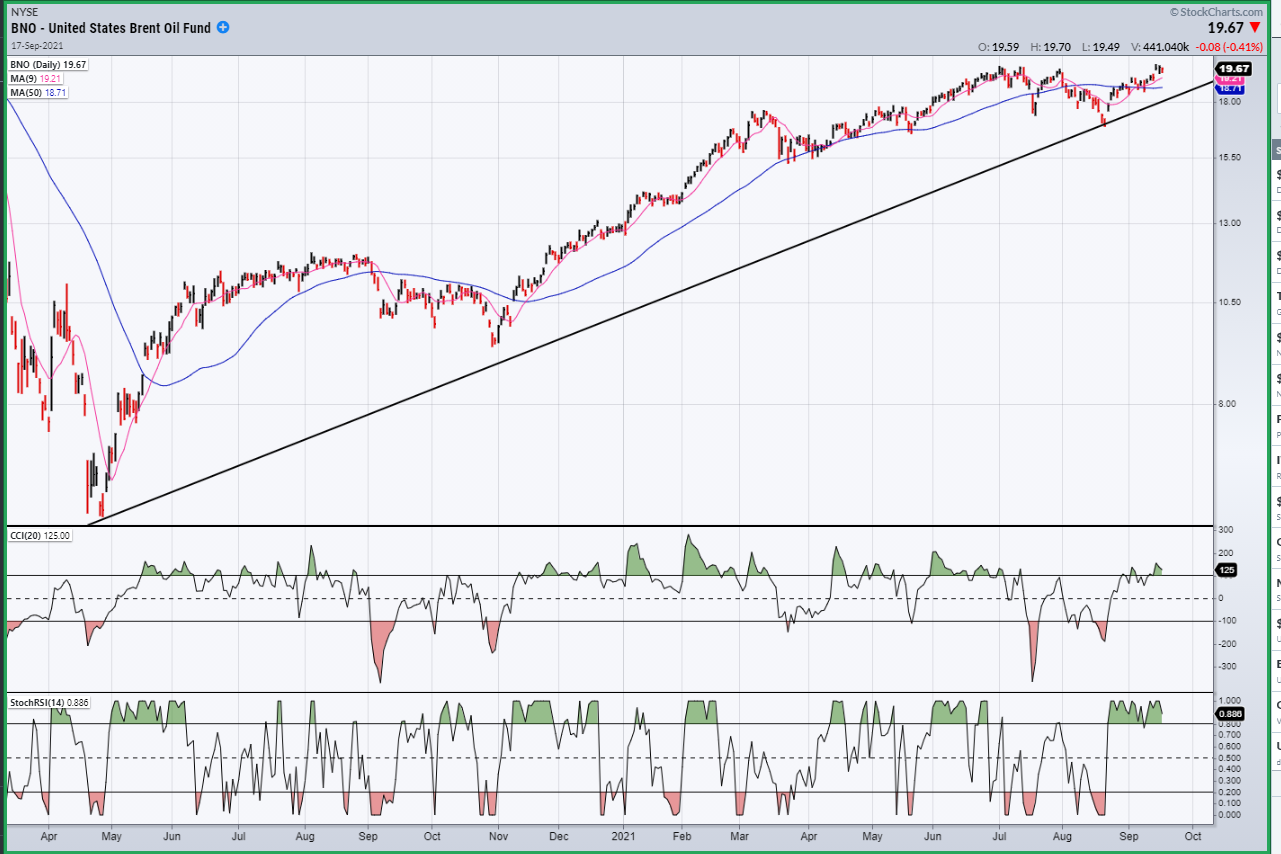
BNO (Brent oil fund) dly
BNO twice neutralized a break below the 50-dma. Also, the pullback was in three phases which characterizes it as a correction. It may now be on the way to 22 before finding sellers.
Author

Andre Gratian
Market Turning Points
When I was a stock broker years ago, a friend introduced me to technical analysis of the market and it is not an exaggeration to say that I fell in love with this approach! Ever since then, it has become an increasingly important


