Market sentiment pressured as yields and the dollar climb again

Market Overview
Market sentiment is turning more fearful as treasury yields continue to climb. All the talk in recent days has been of the US ten year yield reaching 3% for the first time since January 2014. This is nothing more than a psychological level but seems to have caught the attention of the market, as Wall Street indices fell sharply back yesterday with 3% tested again. We are in the midst of earnings season which continues to be strong but the market appears to be fully priced and in this environment of sharply rising bond yields, the fear is driving risk appetite backwards. Bond markets will now be eying the January 2014 high on the 10 year yield which is a peak of 3.04%. The dollar has been gaining as focus has turned back on the widening interest rate differentials and on the chart of Dollar Index 91 is a key pivot level to watch now. The question is also whether these market moves begin to show a decisive safe haven bias once more similar to the February fears (at that time driven by the sharp increase in US wage growth data).

Wall Street closed sharply lower with the S&P 500 -1.3% at 2634, whilst Asian markets were broadly lower (Nikkei -0.3%) and European markets are decisively weaker early today. In forex, the dollar is performing stronger across the majors once more, with the higher risk commodity currencies, the Aussie and Kiwi, in the firing line initially. In commodities we find gold back lower amidst the dollar strength ($1321 is the support to watch near term), whilst oil is consolidating early today after falling sharply yesterday in a surprise API inventory build.
There is very little on the economic calendar today aside from the EIA oil inventories at 1530BST which will be watched after the API data yesterday showed a surprise inventory build in crude. For the EIA inventories today, crude stocks are expected to drawdown by -2.7m barrels (after a surprise drawdown of -1.1m barrels last week), with distillates expected to drawdown by -0.8m (-3.1m last week) and gasoline stocks in drawdown by -1.1m barrels (-3.0m barrels last week). Traders of the Canadian Loonie will be on the lookout for the comments from the BoC Governor Poloz after his dovish comments over the weekend further hit the CAD.
Chart of the Day – AUD/USD
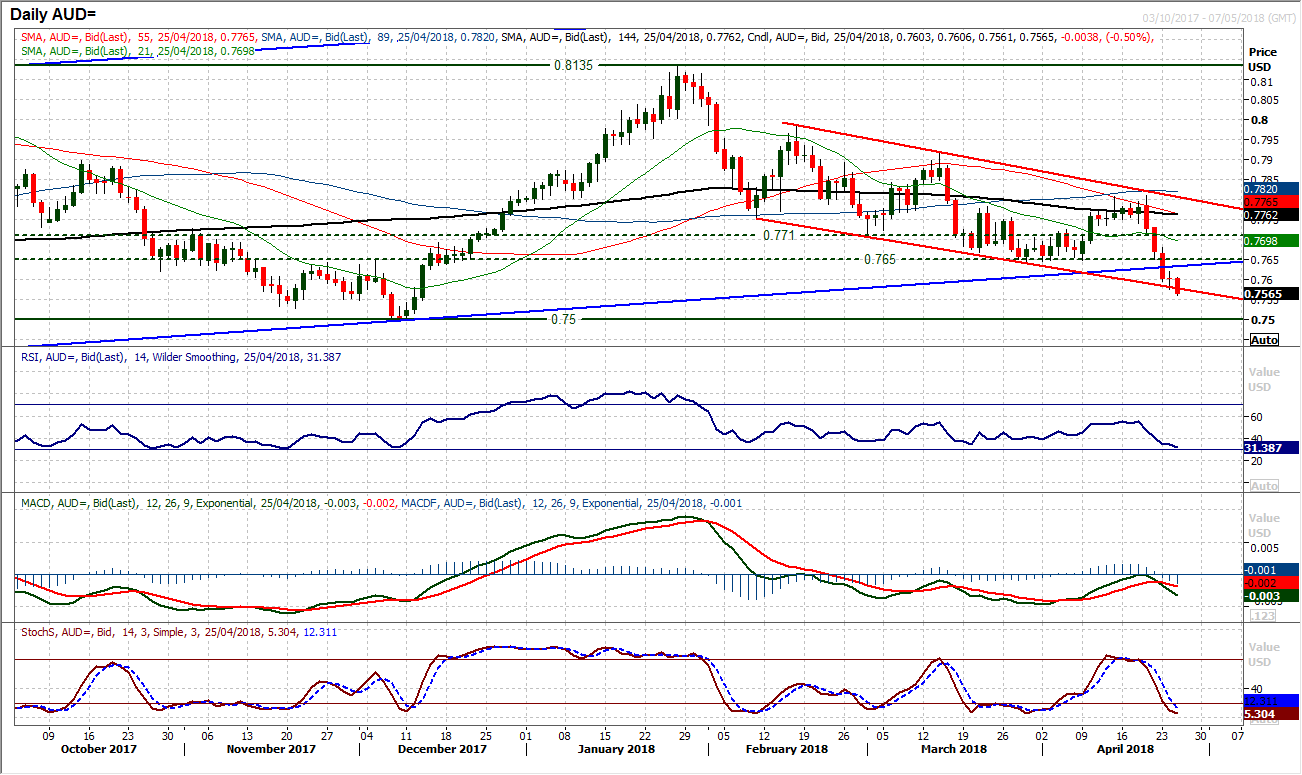
Aussie/Dollar is a tale of trend channels. The recent sharp deterioration over the past four sessions has dragged the market back to the bottom of a three month downtrend channel, but more importantly, in the process has now completed two closes in breach of the huge long term uptrend channel that has been pulling the market higher since 2016. Breaking the support at $0.7640/$0.7650 continued the recent run of lower highs and lower lows but also has re-opened the key December low at $0.7500. The momentum indicators are still negatively configured with the MACD lines turning lower and Stochastics accelerating lower. A brief respite in the selling pressure yesterday seems to have been just that as the market ins breaking lower again today. Any rallies seem to be a chance to sell now. There is a band of resistance between the overhead supply of the $0.7650 breakdown and an old pivot at $0.7710. The hourly chart shows negative configuration and unwinding moves are being sold into.
EUR/USD
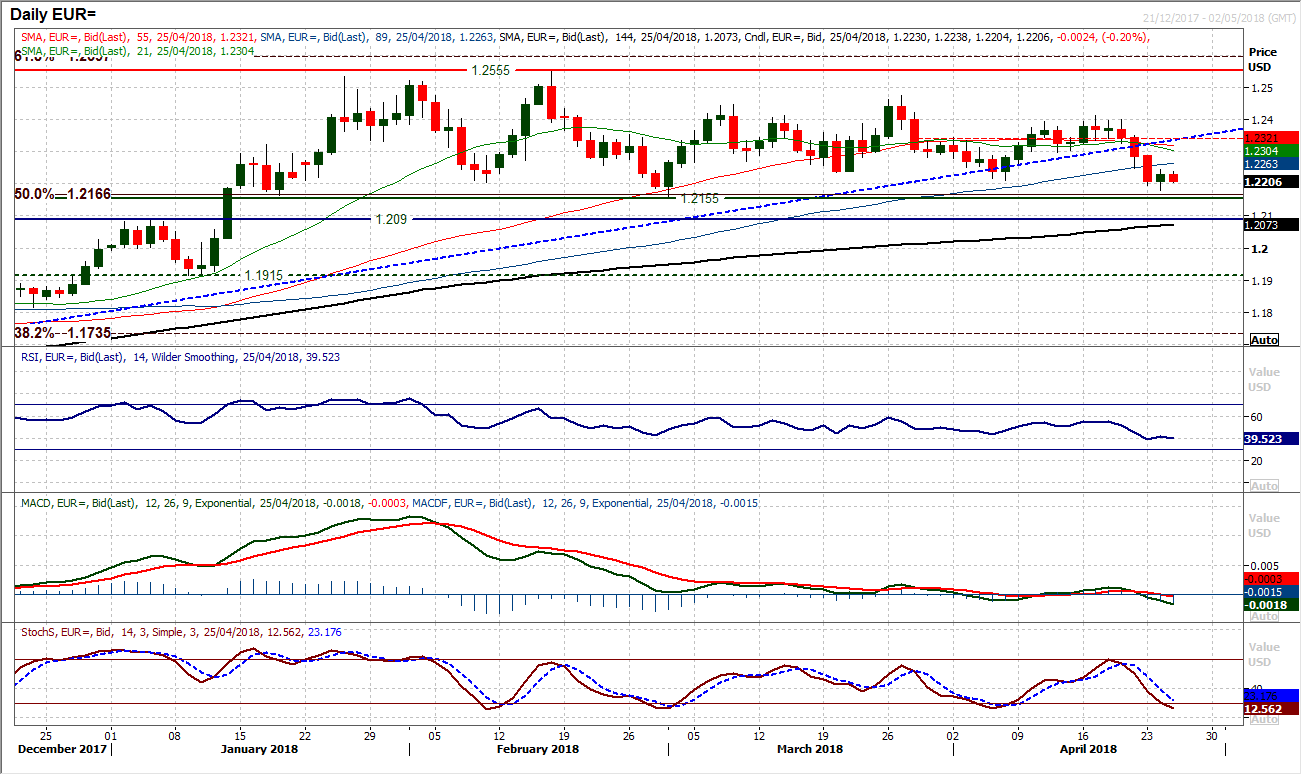
Bulls of the euro managed to stop the rot to an extent yesterday as the pair found enough of a bid to forge initial support at $1.2180. However there is still much to be done to suggest the end of the selling phase has been reached. The bottom of the key medium term range support at $1.2155 is still under threat as momentum indicators continue to suggest rallies are a chance to sell. The MACD and Stochastics are still in decline whilst the RSI is hovering around the 40 level that seems to be an area where the support tends to form. Will it do so once more? The hourly chart is not overly encouraging for the bulls as the rebound has once more failed around 60 on the hourly RSI and is posting a bear cross on the hourly MACD lines around neutral. This suggests the sellers are ready to go again this morning. There is an area of resistance around $1.2245 up towards $1.2300 now which is now key near term. A failure to gather positive momentum to break back above will heap ever more pressure on initial support at $1.2180 and then $1.2155. A breach of the three month range low opens $1.2090.
GBP/USD
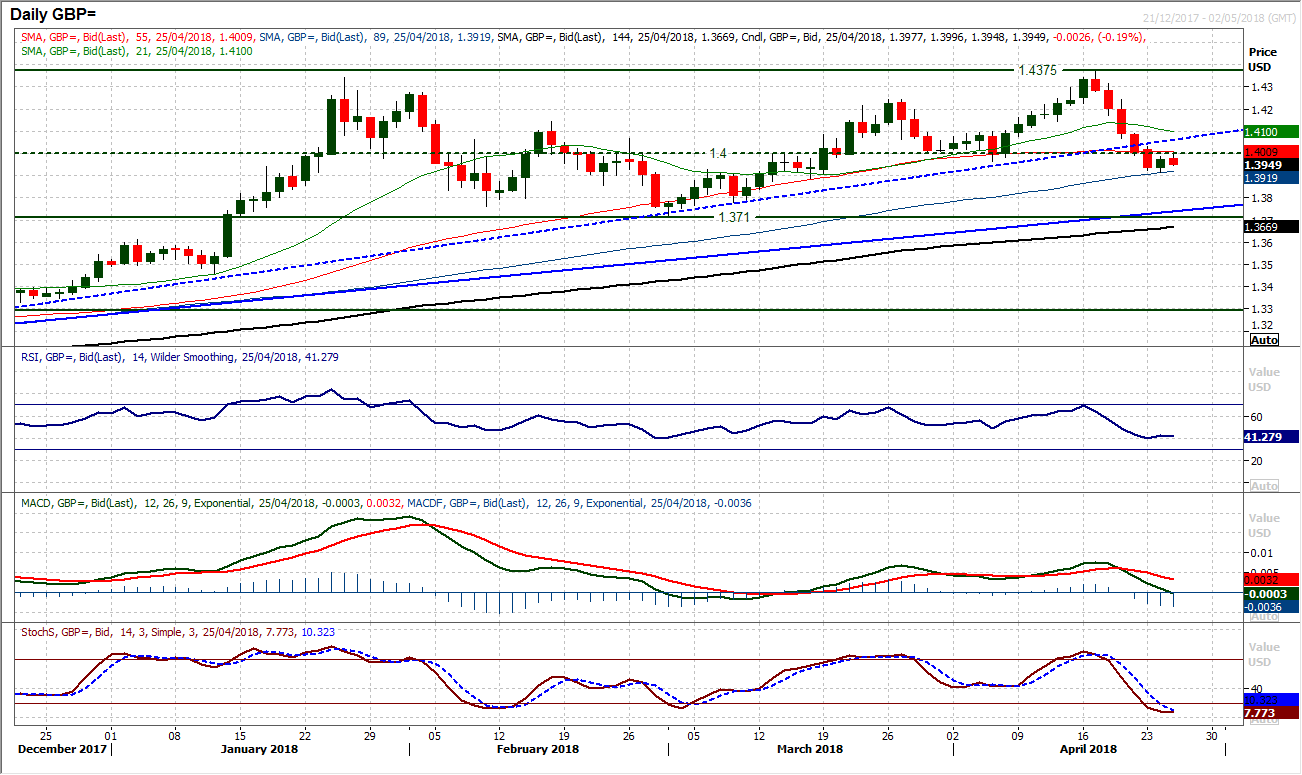
It is one thing forming a consolidation to stop the rot of selling pressure, however it is another thing being able to form a recovery. The market has ended a run of five consecutive strong bear candles with a minor bounce from support at $1.3915. However the broken support band $1.3965/$1.4000 is now a basis of resistance that will be housing a lot of nervous Cable bulls. The market subsequently continues to trade under the $1.4000 medium term psychological pivot. The daily momentum indicators are interesting though in the fact that they are back around key medium term levels. The RSI has ticked higher again from 40 whilst the MACD lines are still simply corrective above neutral. The Stochastics are negatively configured though and need to pull higher for a sign of encouragement. The hourly chart however shows the recent recovery is losing steam and the hourly RSI is rolling over around 60 and MACD lines crossing over around neutral. Initially $1.4000 is the gauge, but the bulls really need to recover above $1.4100 to suggest any real traction in a recovery. Otherwise the bias remains lower with $1.3915 open and $1.3885 the next support on the way to the key support at $1.3710.
USD/JPY
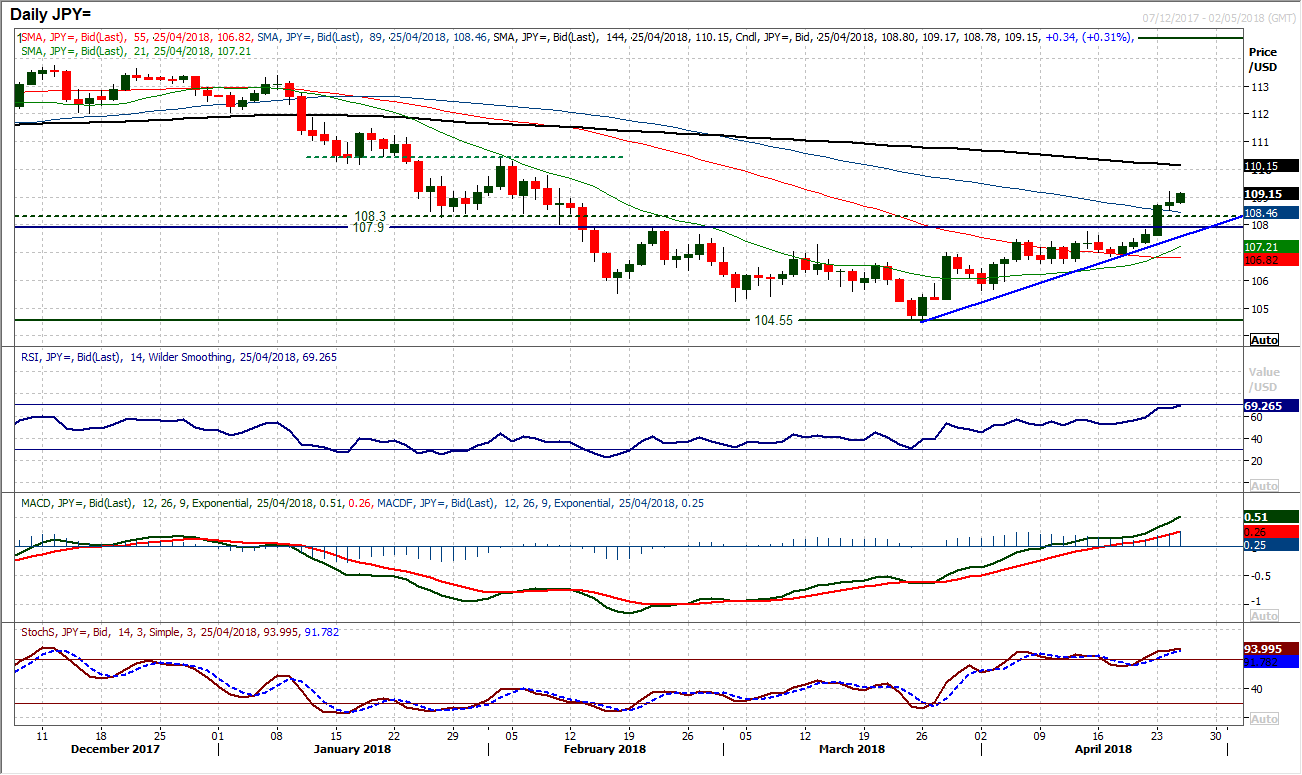
The market has now posted five consecutive days of gains and is threatening to turn this into a sixth as the momentum in the recovery on Dollar/Yen remains strong. The RSI is rising into the high 60s, whilst the MACD lines are accelerating higher above neutral. Resistance levels seem to be easy to overcome at the moment as the market pushes up to 109.00. The next resistance in the old January/February consolidation band between 108.30/110.50 comes at 109.80, and with the strength of the near term momentum there is little reason not to think that this level will be tested. The hourly chart shows that a brief bout of yen recovery yesterday has simply given another chance to buy again, with the momentum indicators all picking up again from key bullish areas (for example the hourly RSI again picking up from around 45/50). Initial support is at yesterday’s reaction low of 108.55 but the main basis of support if 107.90/108.30 now.
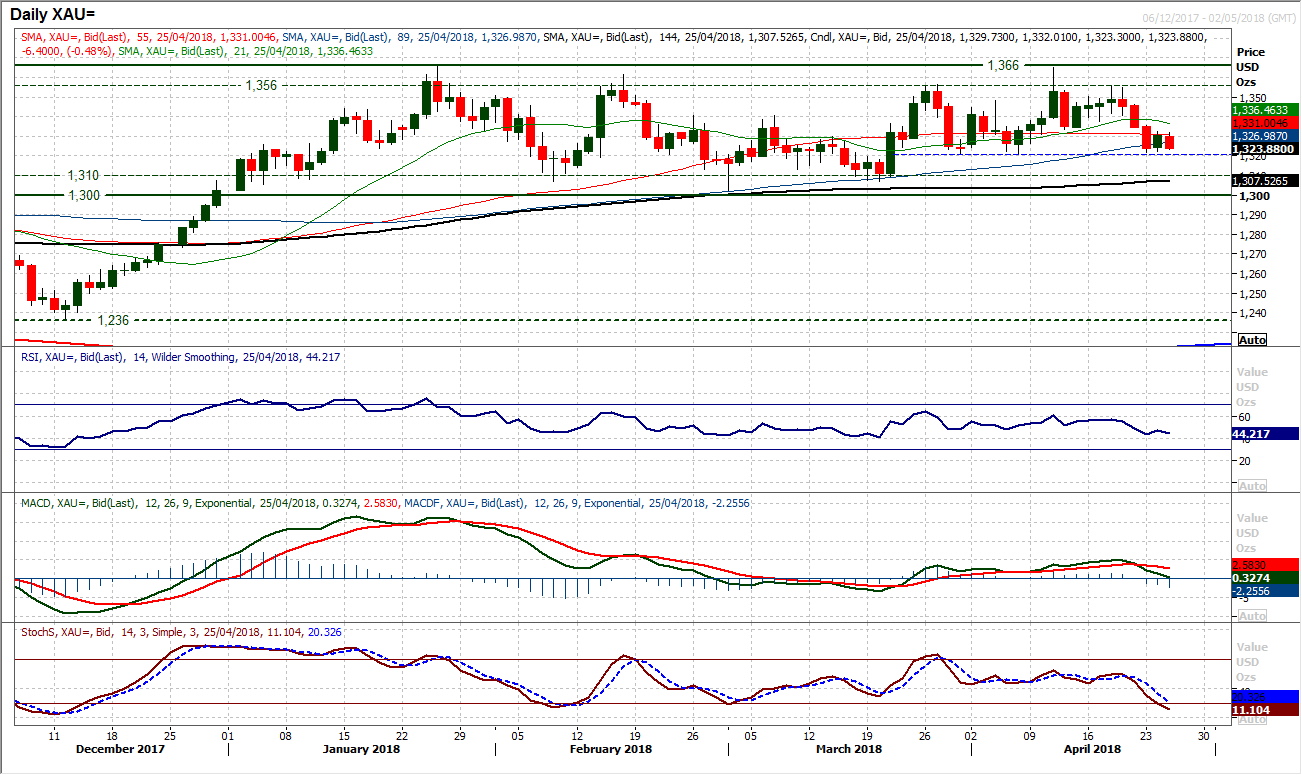
Gold
The bulls picked up to defend the initial support at $1321 yesterday but the power of the corrective momentum is still threatening the support as the market ticks back lower again early today. There is a near term deterioration in the MACD and Stochastics lines that suggest the bulls should not be complacent at $1321. This is reflected on the hourly chart where the rebound has failed around initial resistance at $1333 with momentum indicators throwing off a range of near term sell signals again early today. A breach of $1321 would open the key support band between $1300/$1310 which has been a pivot over the longer term and could again be tested. For now the technicals are not showing any real groundswell for a decisive bear move but watch the RSI dropping below 40, as this would be a warning sign.
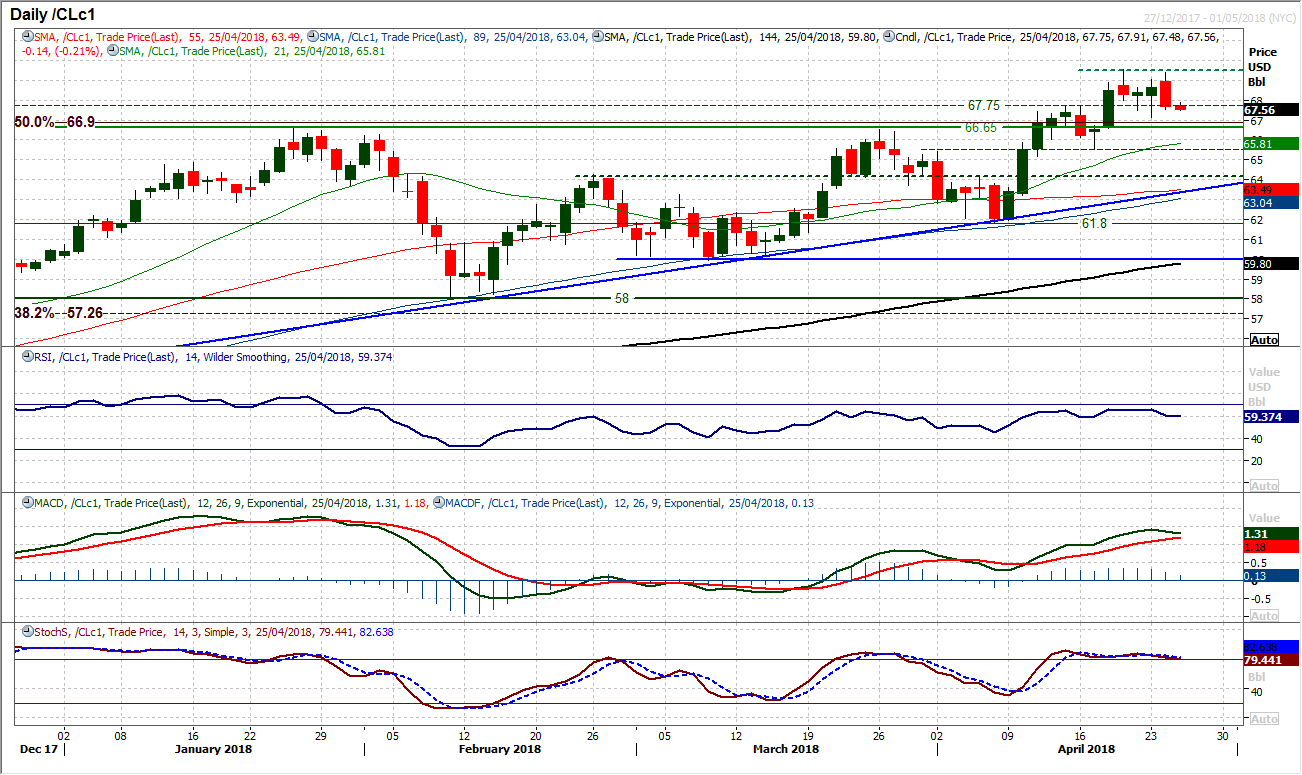
WTI Oil
The bulls that pulled the market from another higher low at $67.15 seemed to lose their way during yesterday’s negative session, and the result seems to be that the market is now into a phase of consolidation. A flip of bull and bear candles in recent sessions shows that support is ready to form in the range $66.65/$67.75 but the breakout has been put on hold for now. Candles such as yesterday generally reflect the need for caution in chasing the prevailing trend, and although there is a broad mood of momentum strength, the hourly chart is now reflecting more of a near term outlook of range consolidation. For now the weakness remains a chance to buy but if the recent low at $67.15 is broken then the pressure on the old breakout support of $66.65 will grow. Initial resistance at $69.55 is strengthening all the while.
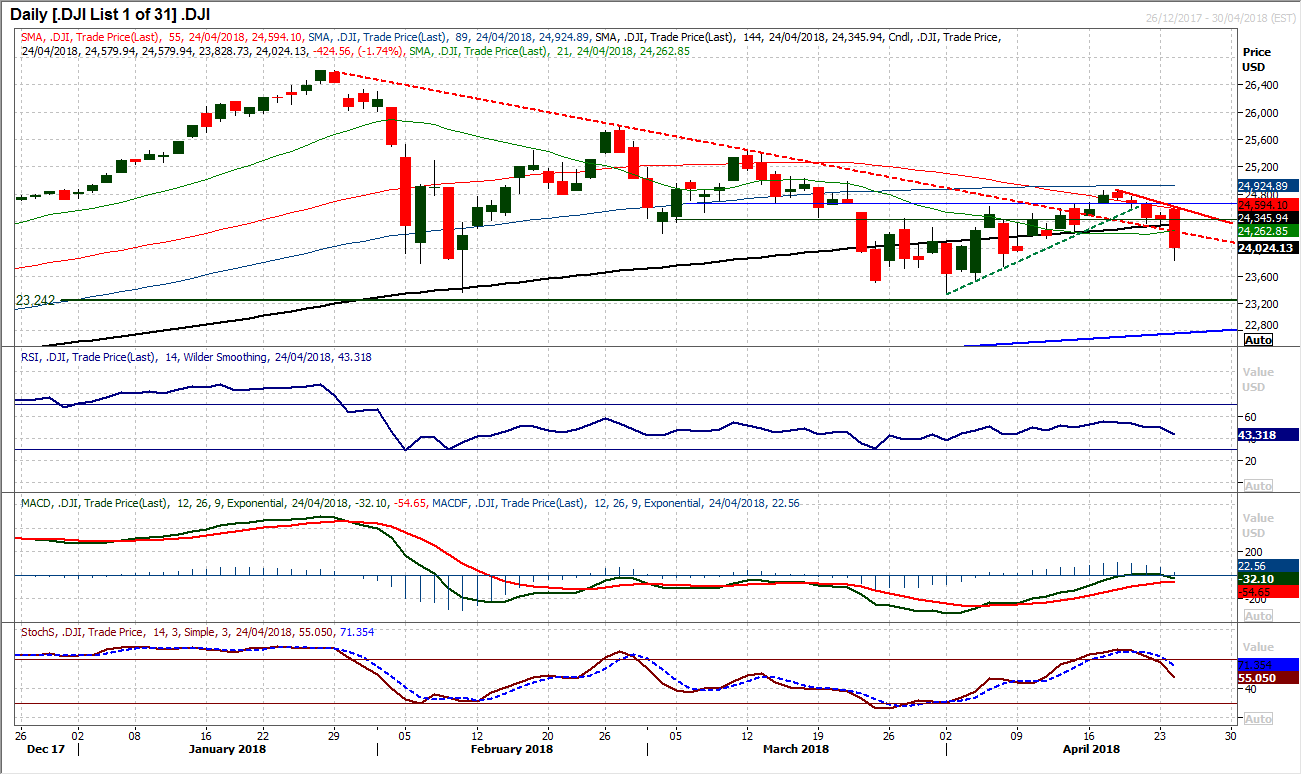
Dow Jones Industrial Average
The selling pressure has been mounting in recent sessions without a decisive move to show for it, but this changed yesterday with a sharp bear candle that now reflects a decisive shift in the near term sentiment. The early April recovery is now being decisively unwound and bear signals are coming through thick and fast now. A Stochastics sell signal has been confirmed, whilst the MACD lines are also now close to crossing lower under neutral (never great for the bulls). The market has decisive broken back below the olf pivot band 24,450/26,650 and also starting to break below the higher lows of the recovery. Although the market bounced from 23,829 last night, the next reaction low is at 23,728. Previous support now turns into resistance and there is a band of overhead supply initially at 24,244/24,375.
Author

Richard Perry
Independent Analyst


