Market sentiment driven by vaccine news

Post-election and vaccine driven euphoria persist to support the markets’ risk-on sentiment. 88% of S&P500 constituents are currently trading above their 200-day Moving Average, the highest proportion since June 2014. Optimism seems to be fueled primarily by the newsfeed about vaccines and their efficacy, ignoring the fact that we still need to live through the time from now until the time the vaccines become available a large scale. Notwithstanding that fact, most asset classes have made moves that support short- to medium-term risk taking in equities, while avoiding safe haven assets.
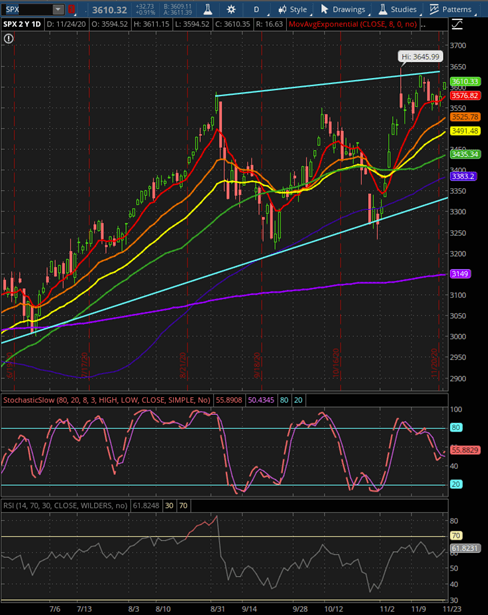
S&P 500 took a decisive swing higher after the elections. Short- and long-term momentum indicators are pointing to a very bullish sentiment while daily price action is supported by 8-day Moving Average. Key resistance level of 3,580.00 was broken last week, leading to a new all-time-high. We can expect the next potential resistance level to form near 3,640.00. Stochastic of 54.8 and RSI of 61.5 are both neutral and not indicative of overbought levels. ADX is currently near 19.3 and decreasing, which signals potentially weakened trend,but DMI+ is still at 32.4. We would expect this bullish momentum to persist, as long as the double-bottom formed in September and October near 3,208.00 – 3,235.00 is not decisively broken.
Russell2000 index, consisting of small-cap stocks, is carried by the same vaccine driven optimism. Russell may be a better indicator for the sentiment and hope for normalization, given its constituents. The index has broken previous resistance levels near 1,660.00 to 1,700.00 earlier this month and shot to new all-time-highs of 1,846.00. Russell had been lagging other indexes after March meltdown. Momentum indicators are bullish but RSI of 73.8 and Stochastic of 91.2 signal overbought levels. Also, price is currently close to upper Bollinger Band of 1,883.84. ADX of 34.4 and DM+ of 41.2 are encouraging that the trend is still intact, albeit price action may need take a breather in the short-term.
Gold has fallen through 1,848.00 support level and lower Bollinger Band of 1,820.00, and is currently kissing 200-day Moving Average at 1,796.00. That price point coincides with support levels established back in July. Short-term Moving Averages are all bearish and assuming 200-day MA is broken we are looking out for the next resistance level near 1,683.00. Stochastic of 16.6 indicates an oversold level, while RSI is neutral. ADX is near 20 and gradually increasing, while DMI- at 51.3 might give us guidance that gold might march lower.
DXY continues to trade in the channel of 92.00 to 94.5 established in July. Attempts to break higher have been stopped by a diagonal resistance level which transformed into support levels near 92.00. Momentum indicators are bearish, and the price has been stopped by 8-day MA, signaling a strong downward trend. Stochastic of 32.3 and RSI of 40.7 are both neutral and ADX of 12 also non-revealing. Breaking key support of 92.00 would support the case for continuation of downward trend, while breaking resistance 94.50 may indicate that the dollar is ready to reverse the losses accumulated during the second half of 2020.
Author

Kaia Parv, CFA
Independent Analyst
Kaia Parv is ex Head of Investment Research at a European brokerage house, ex Investment Associate at a Singapore based hedge fund, managing U$ 250m dollars, and also ex Vice President at Bank of America Merrill Lynch.


