Market insight for the week ending 3rd February

It is all about the central banks this week; the blockbuster week welcomes the US Federal Reserve (Fed), the European Central Bank (ECB) and the Bank of England (BoE), all of which are anticipated to increase rates.
The Fed steals the spotlight on Wednesday with markets more or less pricing in a 25 basis-point hike, action that would move the Federal Funds target range to between 4.50% and 4.75%. 2022 witnessed a mammoth policy tightening schedule out of the Fed, raising 425 basis points from 0.25% to 4.50%. In fact, this was the largest bout of policy tightening seen in 40 years, consisting of four eye-watering 75 basis-point hikes during Q3 and Q4.
December’s meeting observed that the central bank slowed to a 50 basis-point increase, with this week’s meeting expected to slow once more to 25 basis points. The slowdown in policy tightening is considered warranted given the disinflationary phase the US economy is in—consumer prices are increasing but at a slower pace. Annual inflation peaked in June last year at 9.1% and, thanks to the latest release from the Bureau of Labour Statistics (BLS), we saw inflation slow for a sixth consecutive month to 6.5% in the 12 months to December. The inflation rate, however, remains three times above the Fed’s target, thus the Fed are unlikely to talk much about cutting rates as there’s still work to be done. The latest FOMC Meeting Minutes (released early January) also revealed further rate hikes are on the table and any cuts are doubtful in 2023.
US Consumer Confidence for January is released on Tuesday, expected to increase to 109 following December’s increase of 108.3, up sharply from 101.4 in November. US manufacturing activity, however, recently elbowed into contractionary territory, with the latest ISM release for December showing a 48.4 reading, its second consecutive decline sub-50.0. Wednesday will see the latest ISM print, expected to slow once again to 48.0, though the forecast range is fixed between 49.5 and 47.5. Another headline event out of the US this week, of course, is Friday’s employment situation report. The consensus heading into the non-farm payrolls for January is for a decline to 168,000, yet the forecast range is seen between 260,000 and 130,000. A technical view of the Dollar Index can be found below.
Thursday is a big one for the BoE and the ECB. The BoE dominates the limelight midday GMT, widely expected to increase the Bank Rate by 50 basis points, a move that would pull the rate to 4.00%. Annual inflation in the UK remains in double figures. According to the Office for National Statistics (ONS), in the 12 months to December consumer prices increased by 10.5%, down from November’s 10.7% rate and October’s peak of 11.1%.
Shortly following the BoE, the ECB is anticipated to follow suit at 1:15 pm GMT and raise the Main Refinancing Rate by 50 basis points. Euro area inflation increased by 9.2% in the 12 months to December, down from November’s 10.1% and October’s peak of 10.6%. Like the Fed and the BoE, inflation is far beyond the ECB’s 2% target, hence there is currently an 86% chance of a 50 basis-point increase. A technical view for the EUR/USD can be found below.
Technical view for the week ahead
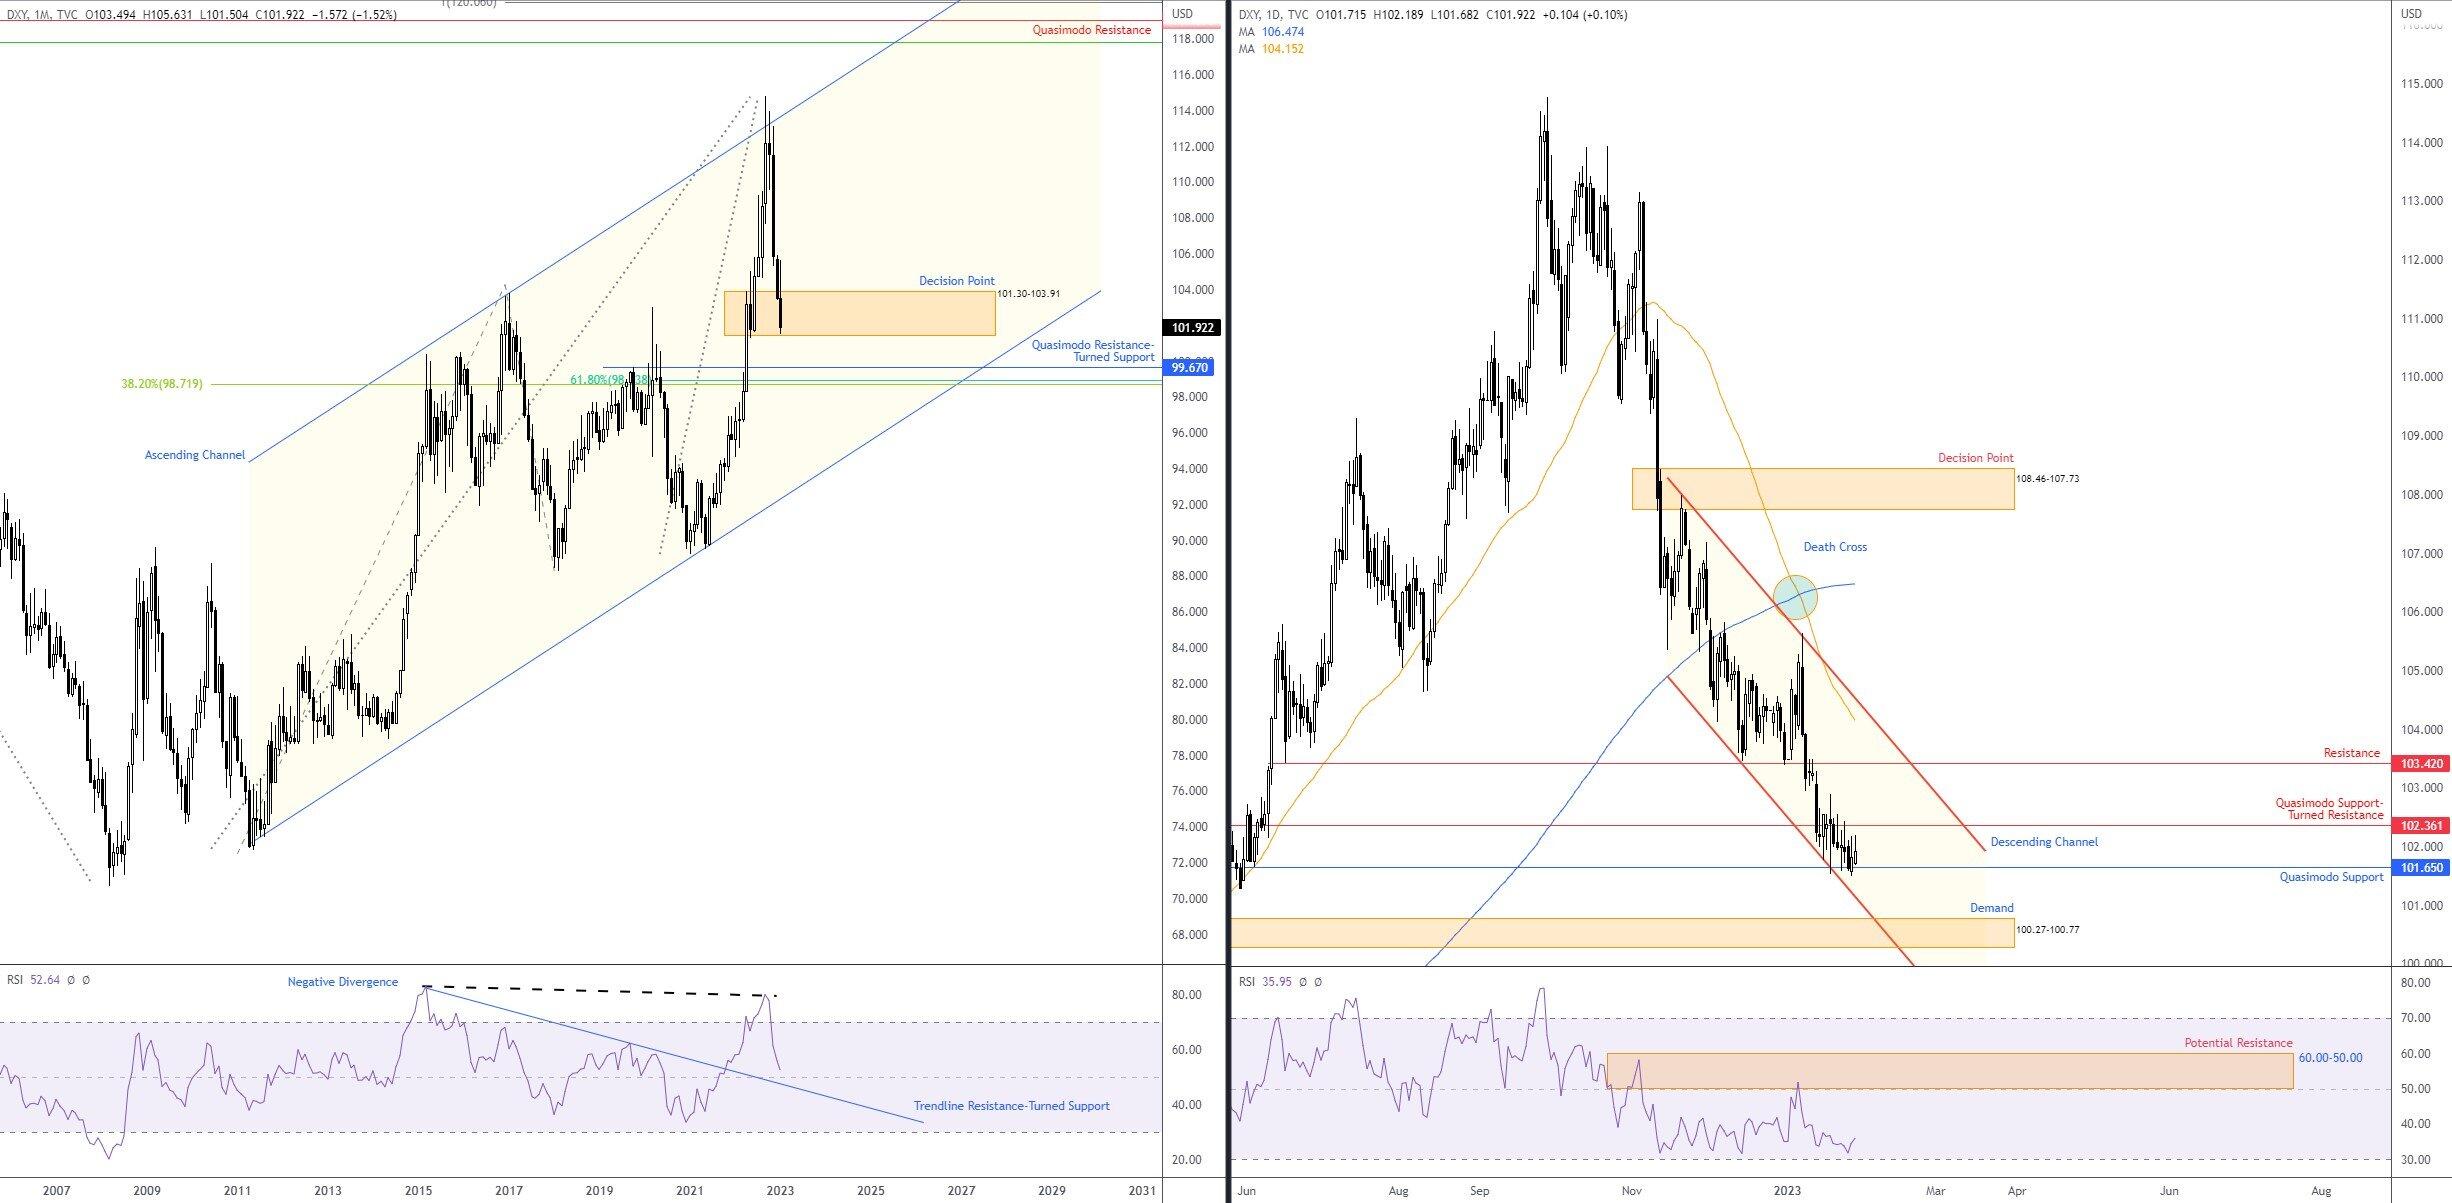
US Dollar Index
The US dollar, according to the US Dollar Index, wrapped up the final full week of January tentatively, pencilling in what is referred to as a doji indecision candle on the weekly timeframe.
Evident from the monthly chart, the greenback is on track to finish a fourth consecutive month under water. As aired in the previous Weekly Market Briefing, a one-sided USD decline unfolded in Q4 of 2022 from an ascending channel resistance, extended from the high 103.82. This led things deep into the walls of a decision point at 101.30-103.91 where buying interest is limited for the time being. Clearing the aforementioned monthly decision point renews the risk of a decline to monthly Quasimodo resistance-turned possible support at 99.67, closely followed by a moderate Fibonacci cluster just south of 99.00. The Relative Strength Index (RSI) also demonstrates scope to drop and test the 50.00 centreline, a barrier that boasts a connection with indicator trendline resistance-turned support, drawn from the high 82.87, and thus could offer a floor if tested. While the above echoes a bearish mood, trend direction has remained to the upside since early 2008 and the recent down move could just be another correction, similar to January 2017.
Considering the hesitant price action of late (the weekly indecision candle), it’s no surprise to see buyers and sellers continuing to square off between Quasimodo support-turned resistance at 102.36 and Quasimodo support from 101.65 on the daily chart (merging nearby with channel support, extended from the low 103.45). Technically speaking, the aforesaid supports remain the last line of defence for the monthly timeframe’s decision point. Discovering space south of 101.65 this week, therefore, unmasks daily demand at 100.27-100.77 while a push north might unwrap daily resistance at 103.42.
Trend direction continues to favour shorts on the daily scale. This is shown through the recent Death Cross. Fashioned through the 50-day simple moving average (104.15) crossing under the 200-day simple moving average (106.47), this signals the potential for a major trend reversal (though this is a lagging indicator and reflects past price movement). In addition to this, since establishing a peak (see monthly analysis), a series of lower lows and highs materialised (traditional bearish trend structure). Finally, aligned with the daily downside bias, the daily timeframe’s RSI shows a temporary overbought region between 60.00 and 50.00. This is common in strong downtrends; so, this might be a location to keep an eye on over the coming weeks for signs of negative divergence and bearish failure swing signals.
As a whole, the consolidation on the daily (between 102.36 and 101.65), along with the daily downtrend and the lack of buying on the monthly scale within the decision point, implies sellers are still in the driving seat and are poised to breakout to the downside, targeting at least daily demand at 100.27-100.77.
Source: TradingView
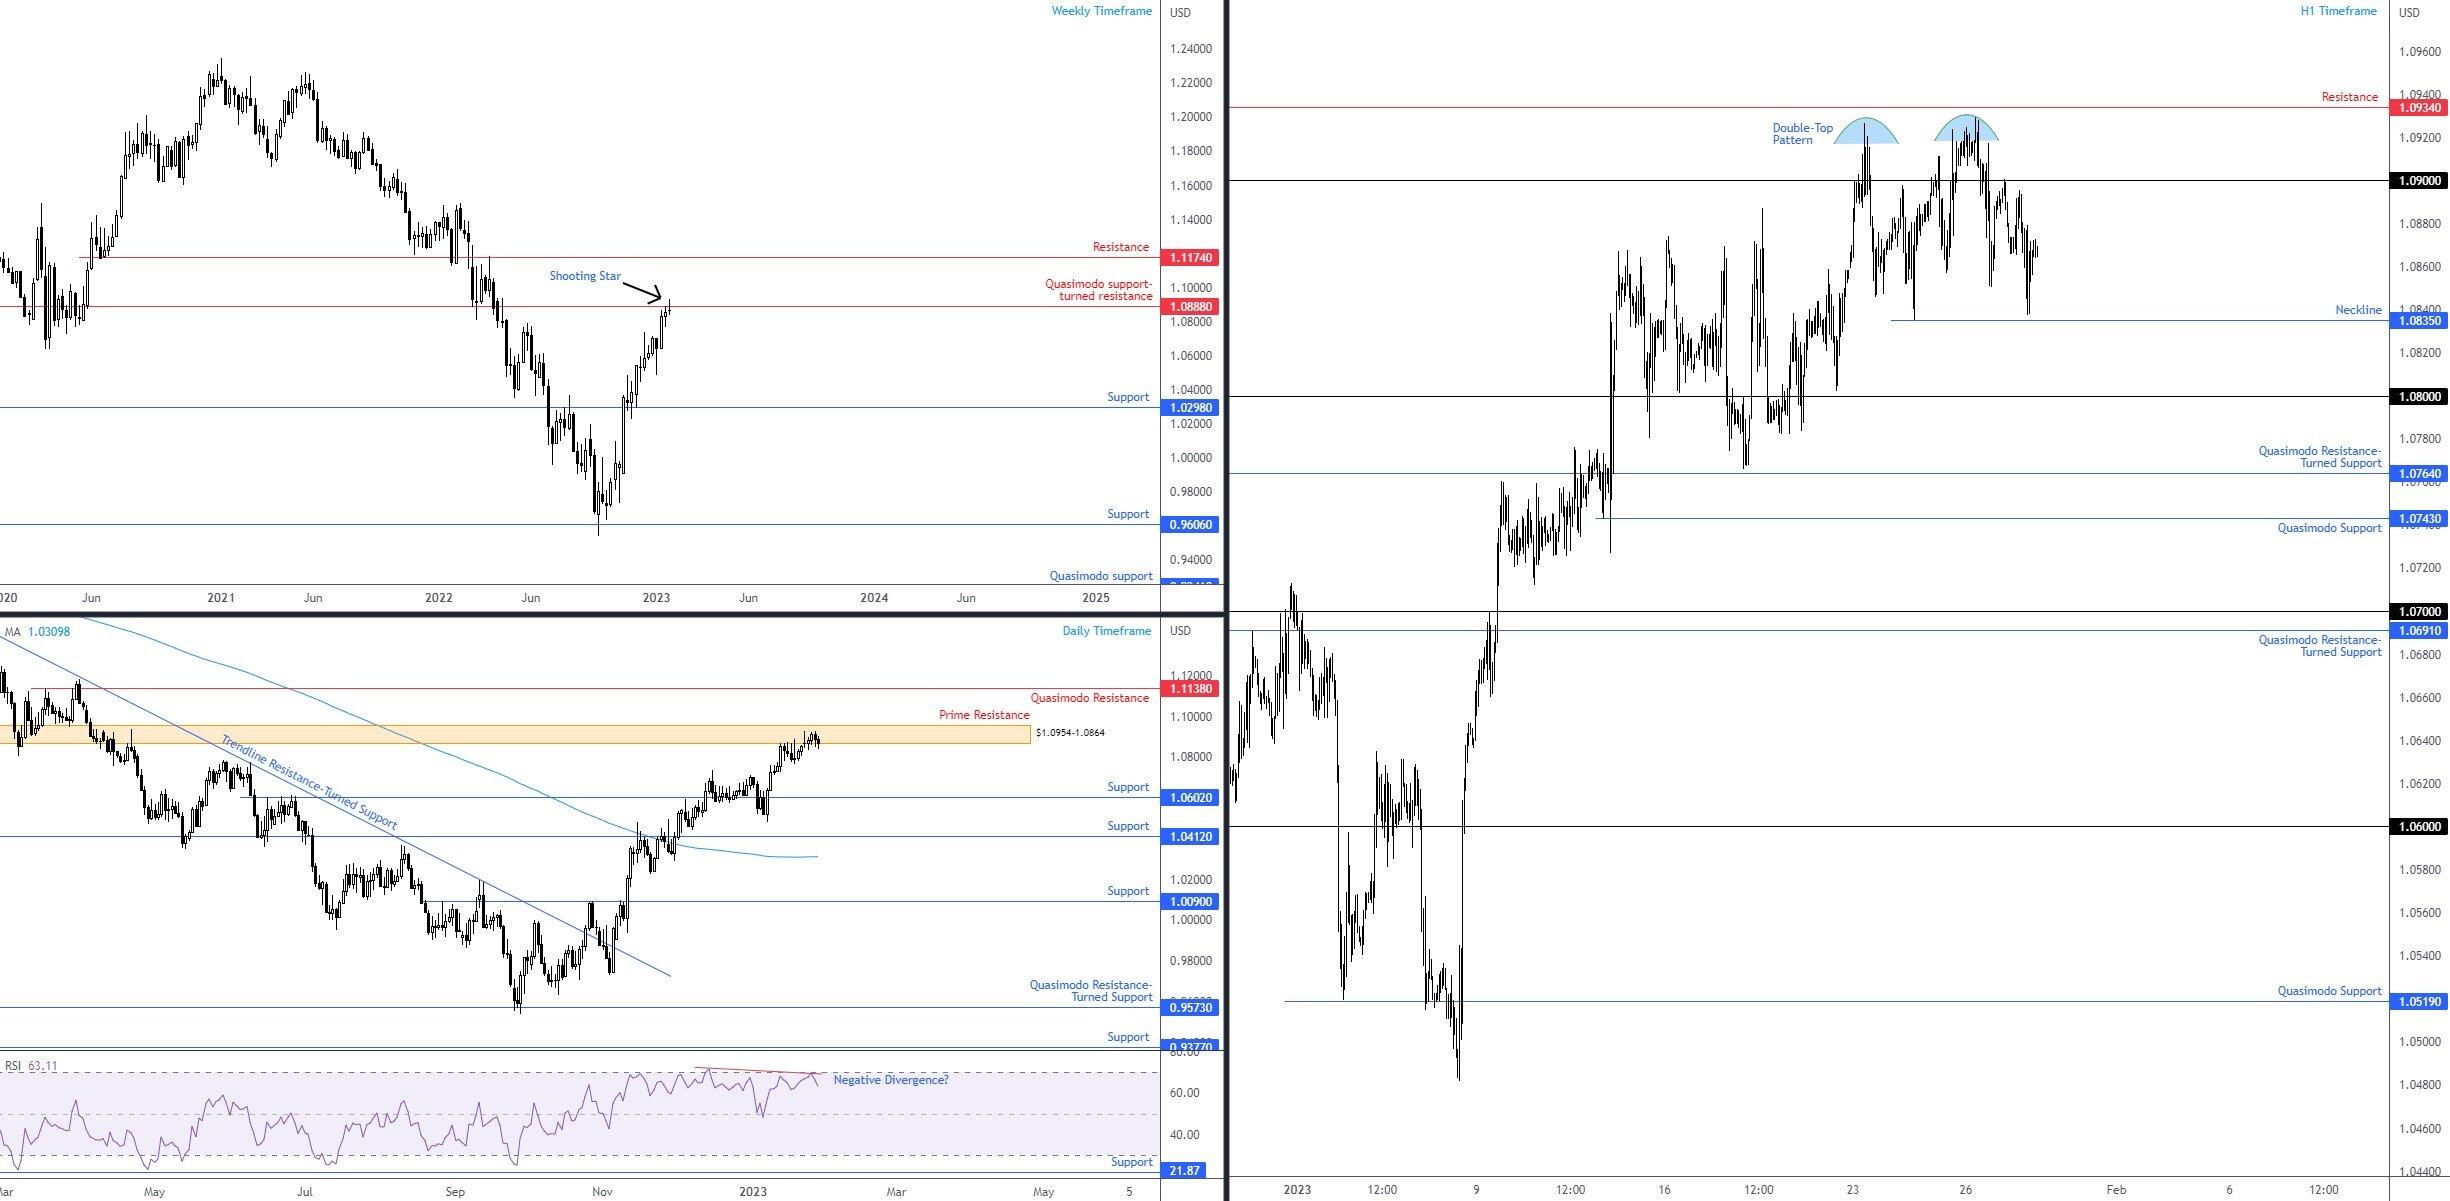
EUR/USD
Concluding the week considerably off best levels—albeit touching values not seen since April 2022—the EUR/USD shook hands with major resistance on the weekly timeframe last week at $1.0888: a Quasimodo support-turned resistance. Interestingly, the response forged a shooting star candlestick formation (bearish signal following a meaningful up move). This combination, in addition to the pullback off late September lows at $0.9536 in a market trending south since 2021, might be viewed as a sell-on-rally opportunity. $1.0888, consequently, will be a key watch this week as rupturing this base undermines hopes of a bearish showing and unearths fresh weekly resistance as far north as $1.1174.
Meanwhile price action on the daily chart is testing the spirit of a prime resistance at $1.0954-1.0864, an area boasting a connection with the current weekly resistance level. Adding to the bearish vibe, the daily chart’s Relative Strength Index (RSI) reveals early signs of negative divergence ahead of overbought space. A downside (price) move could take aim at support coming in at $1.0602. While this is meaningful technical bearish confluence, bullish factors are at play here and splitting the current prime resistance paves the way northbound to Quasimodo resistance at $1.1138. On the daily chart, an uptrend is also clear through the series of higher highs/lows since $0.9536, as well as price crossing above its 200-day simple moving average, currently fluctuating around $1.0310. We can also see that the moving average is starting to level off from its down move: another sign of a potential trend reversal to the upside.
For those who read Friday’s Market Briefing, you may recall the following text regarding the H1:
The H1 timeframe is poised to form what is known as an Adam and Eve double-top pattern just shy of resistance coming in at $1.0934. Last week’s short-term bearish display hauled the pair south of the $1.09 big figure; continued underperformance opens the door for a break of the double-top pattern’s neckline at $1.0835, a move shining light on the $1.08 handle.
Technically, the EUR/USD is bound for lower levels this week, evidenced through weekly and daily resistances, the daily timeframe’s negative divergence (RSI) and the H1 timeframe’s double-top pattern. Conservative traders, nonetheless, may elect to wait and see if H1 price engulfs the double-top pattern’s neckline at $1.0835 before pulling the bearish trigger to target at least $1.08.
Source: TradingView
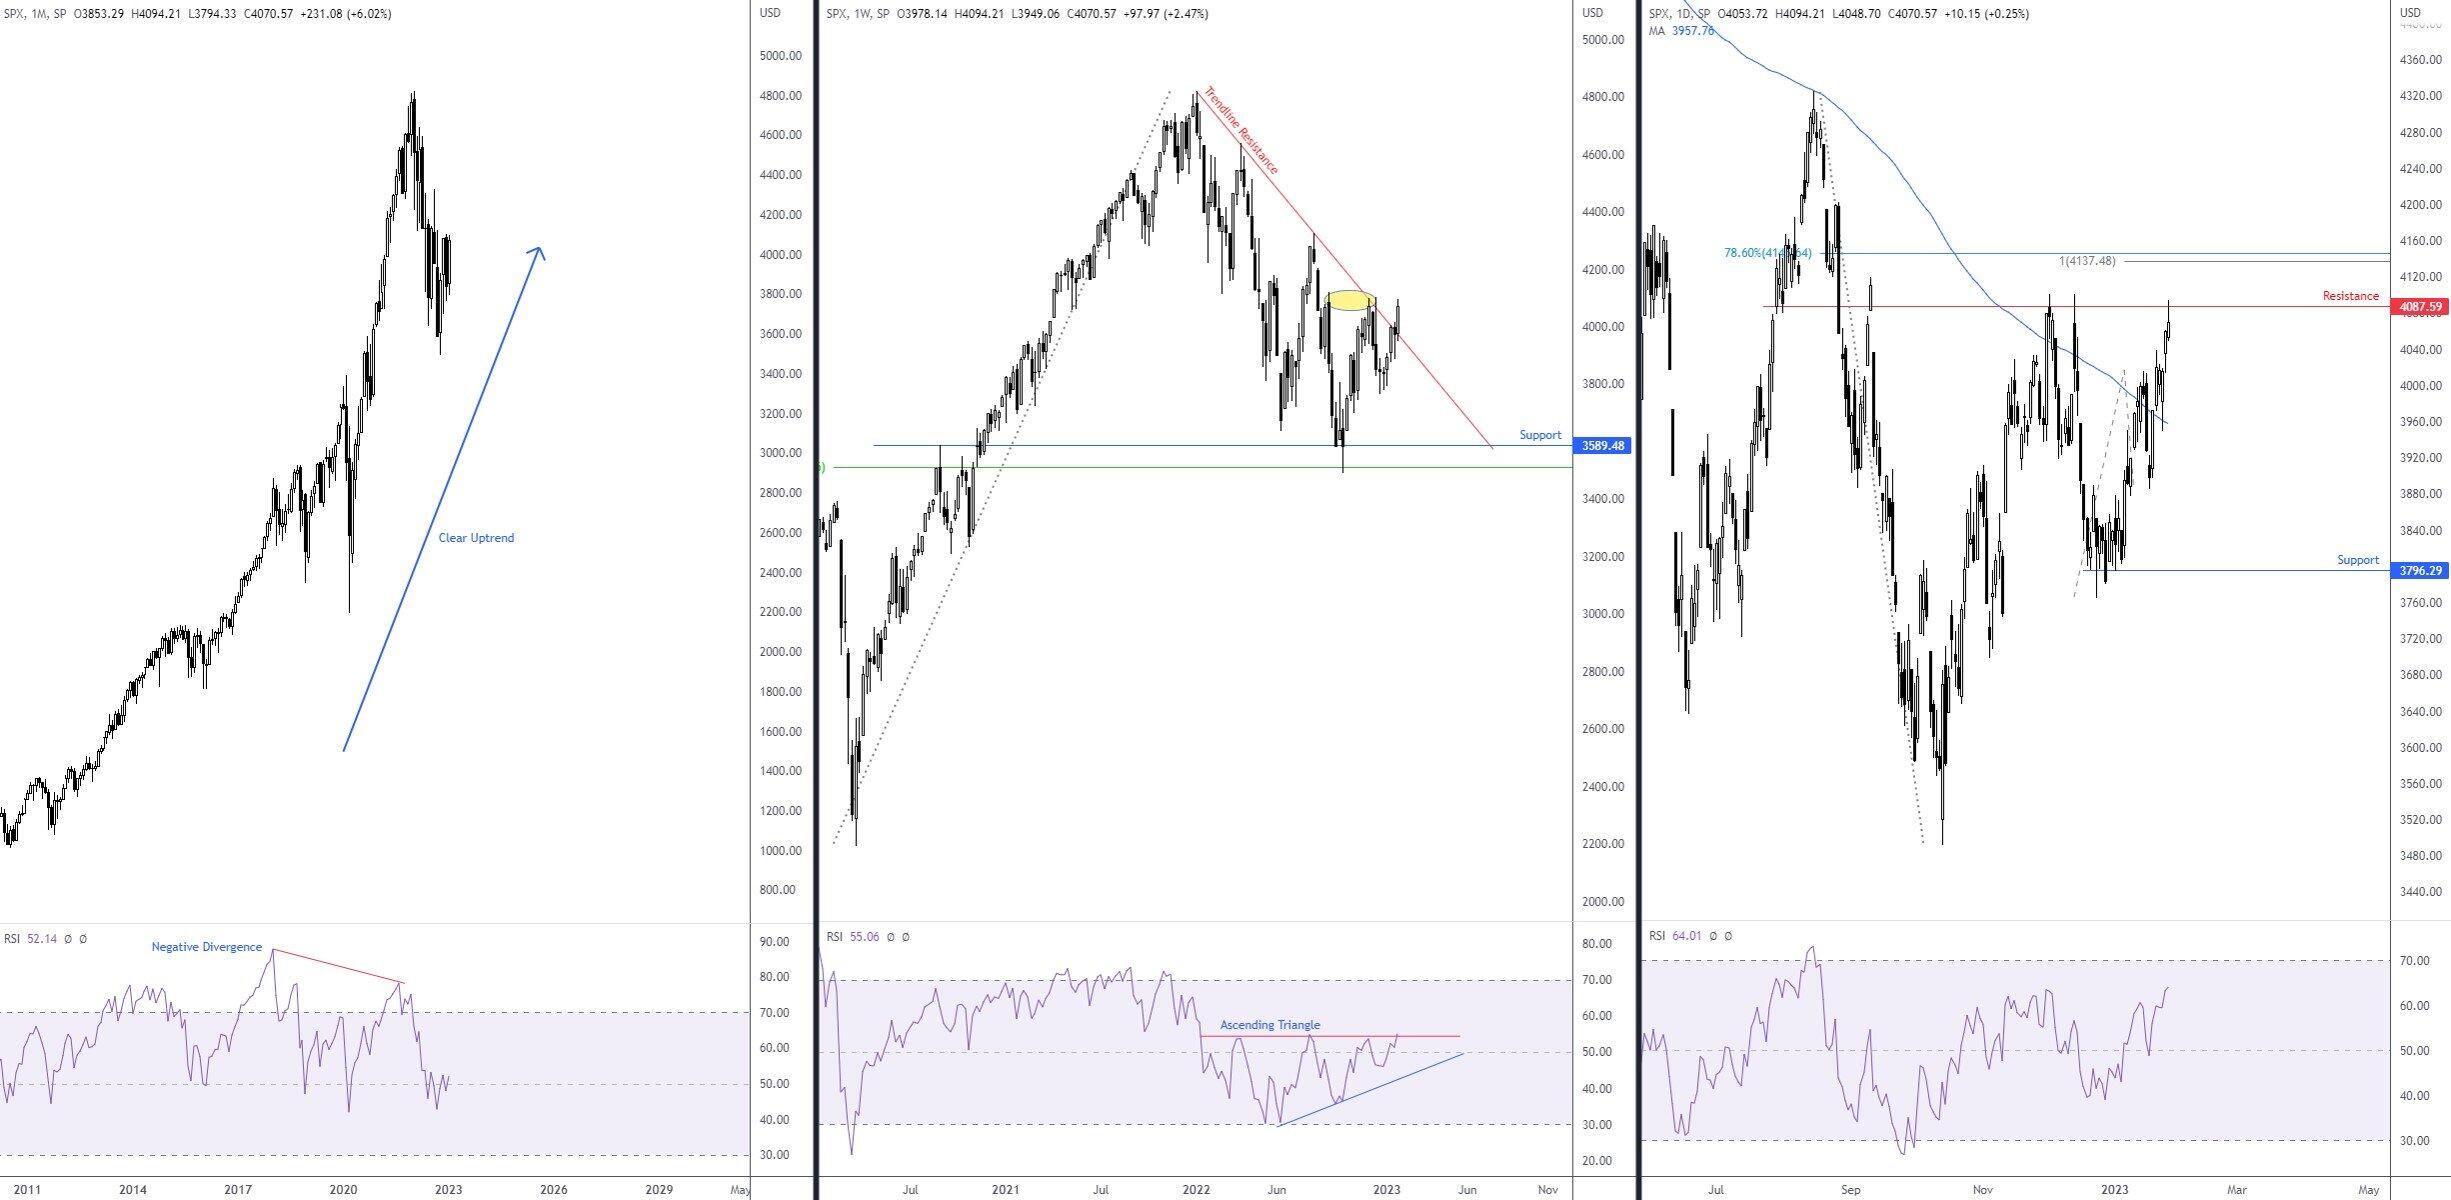
S&P 500
It was a positive week for global equities, largely in the green across the board. The S&P 500—tracks the largest 500 companies listed in the US and is a benchmark performance barometer for the equity space in the US—travelled one-way last week, climbing 2.5% into the close.
The monthly timeframe is simple.
Here is a reminder of the research team’s notes in recent analysis (italics):
The monthly chart has remained in a dominant uptrend since early 2009. We had two notable corrections in that time, one in early 2020 (COVID), dropping 35%, and one in play since early 2022 (27% from 4,818, as of writing) which was accompanied by negative divergence out of the Relative Strength Index (RSI).
Through the simple lens of a technical trader, this is where things become interesting. The weekly chart reveals buyers absorbed offers at the underside of trendline resistance, taken from the high at 4,818. The close higher indicates buyers are looking to change gears and perhaps pursue higher terrain, in line with the monthly timeframe’s longer-term uptrend. Despite a healthy bullish close, though, overhead resistance at 4,085 is nearby, potentially discouraging further buying and opening up the possibility for a bull trap to form.
Bolstering the bullish case, the daily timeframe had price movement breach (and retest) the 200-day simple moving average at 3,957 last week. Holding above this dynamic value brought resistance from 4,087 into the mix Friday (lines up closely with the weekly resistance noted above). Harmonic traders might also note the possible AB=CD bearish formation at 4,137, marked by a 100% projection, and a nearby 78.6% Fibonacci retracement ratio at 4,146.
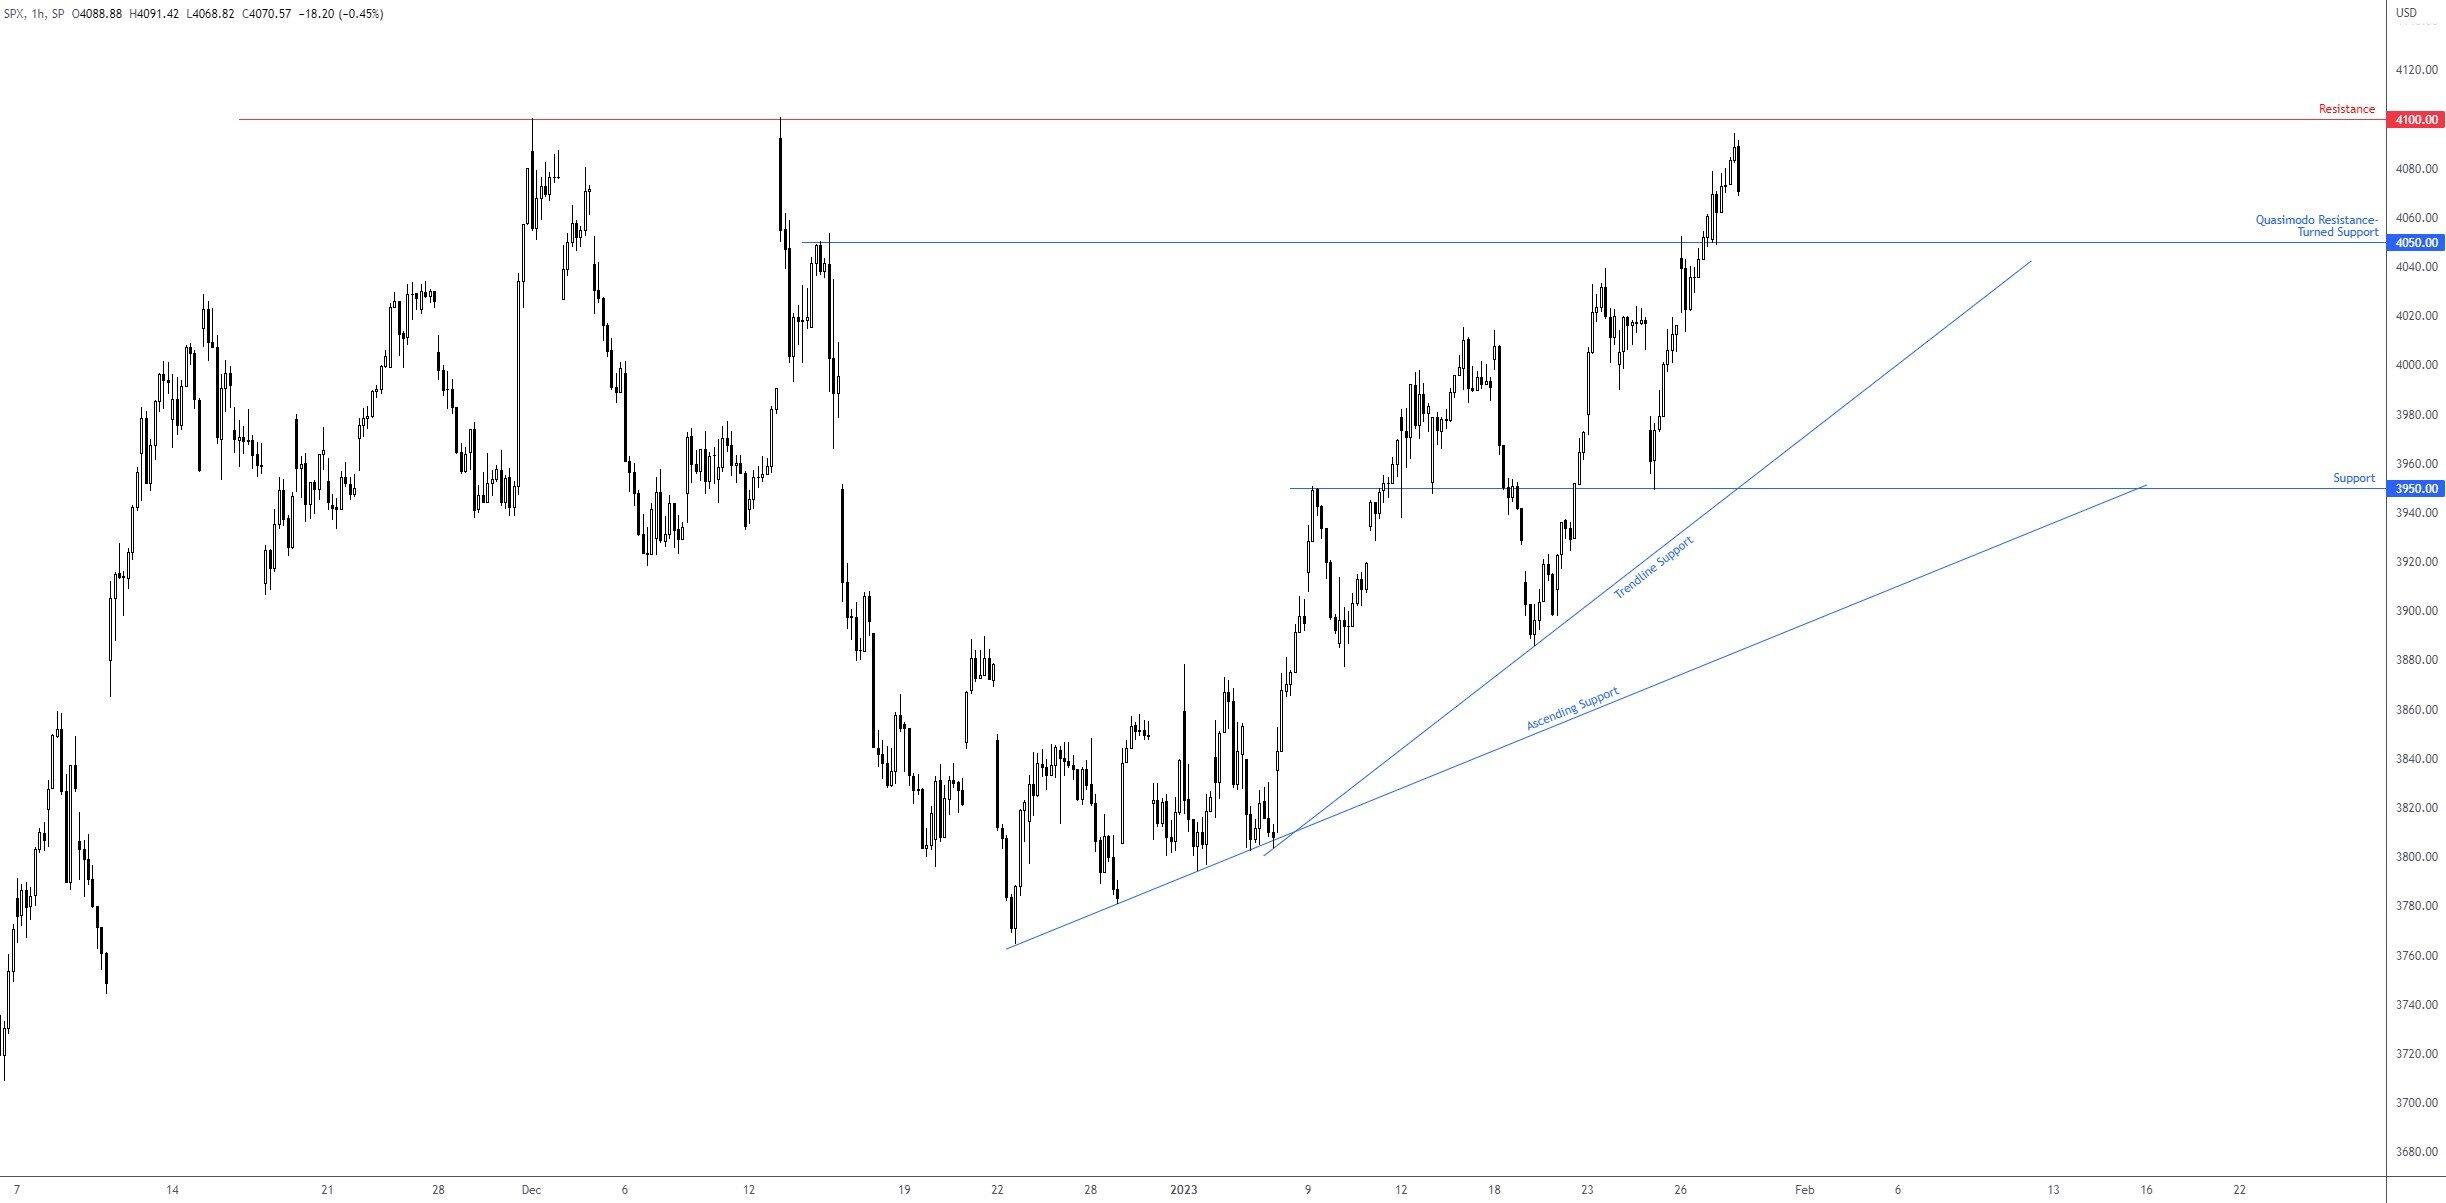
Price action on the H1 timeframe ended the week exhibiting an optimistic vibe, testing Quasimodo resistance-turned support at 4,050 and effectively clearing the pathway for the unit to test daily resistance at 4,087. H1 resistance is seen just north of current action at 4,100, which will likely also be monitored along with the daily resistance this week.
A break of 4,087 resistance on the daily helps reaffirm a bullish breakout scene above trendline resistance on the weekly timeframe, while a 4,087 rejection will be concerning for breakout buyers north of the weekly trendline and could guide the index back to H1 support around 4,050 or even the 200-day simple moving average at 3,957.
Monthly, Weekly and Daily Charts:
Source: TradingView
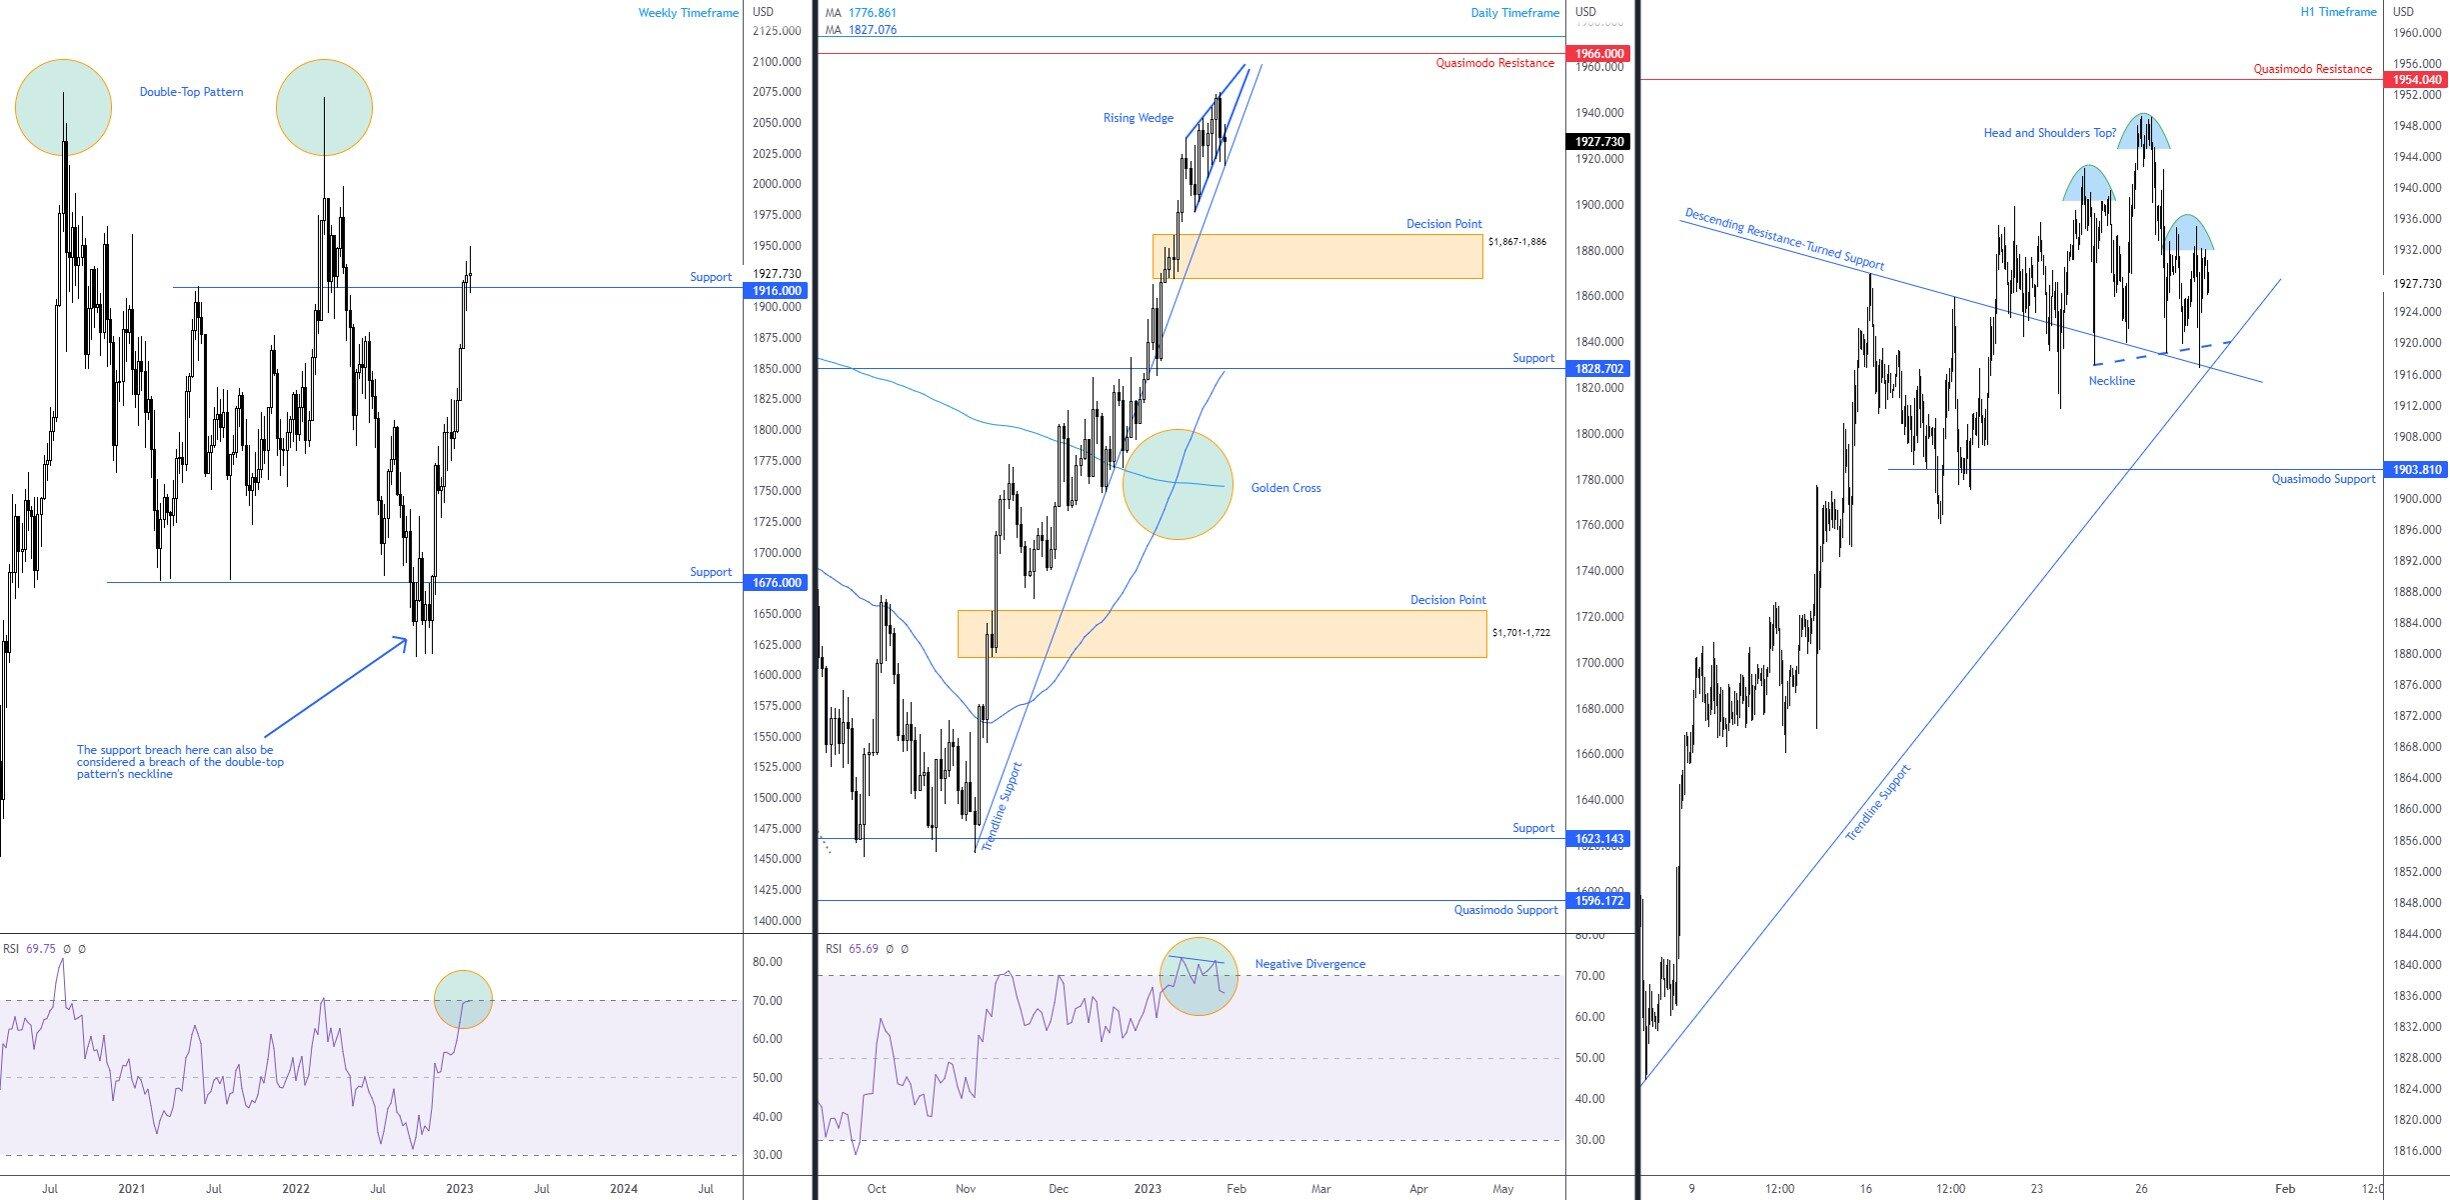
XAU/USD (Gold)
Spot gold, in dollar terms, finished the week eking out marginal gains off weekly support at $1,916. This is the yellow metal’s sixth consecutive week in the green, and, according to the weekly timeframe’s structure, additional outperformance is in the offing, zeroing in on the double-top pattern’s peaks at around $2,070. However, it is important to note that the Relative Strength Index (RSI) is at the doorstep of overbought territory, together with candle action displaying a lack of upside momentum despite successive higher peaks. Consequently, although scope to navigate higher levels is seen, further outperformance might prove lacklustre.
Emphasising the lethargic vibe from weekly action is the daily timeframe’s rising wedge pattern (carved between $1,929 and $1,896), with a feeble break of the formation’s lower boundary observed on Friday. Despite this, continued price compression between the noted converging trendlines that form the rising wedge could also rejuvenate a bearish scenario at Quasimodo resistance from $1,966, closely shadowed by a 78.6% Fibonacci retracement at $1,973 (blue). The decision point at $1,867-1,886 remains unopposed to the downside and a strong-willed breakout south of the rising wedge formation this week may land price at the upper boundary of this zone: a location buyers may show interest from given weekly support residing just above it at $1,916.
As a reminder of trend direction on the daily chart, here is where the research team stands (italics):
The trend is now technically higher, shown by way of steep trendline support, extended from the low $1,616. The trend reversal presented itself in early December last year following the break of the $1,786 previous high in November 2022. Since then, the precious metal also recently welcomed what is known as a Golden Cross, which is the 50-day simple moving average ($1,827) crossing above the 200-day simple moving average ($1,776). This is a pattern trend followers tend to watch and can signal the possibility of a long-term uptrend.
Last week had the H1 timeframe chisel out a head and shoulders top pattern: $1,942, $1,949 and $1,935. The neckline (drawn from the low $1,917), as you can see, has yet to be breached, an ascending line accompanied by a descending resistance-turned support (from $1,929) and a trendline support, taken from the low $1,797. Additional areas of interest fall in close by at Quasimodo support from $1,903 and Quasimodo resistance coming in at $1,954.
Overall, the weekly timeframe is in favour of buyers in spite of slowing momentum. The support is key at $1,916 and can ultimately throw a spanner in the works for the bearish pattern structure on the daily and H1 timeframes. If $1,916 fails, therefore, focus will shift to the daily and H1 timeframes. A push lower could see daily price navigate below the daily rising wedge pattern’s lower edge and the neighbouring trendline support. An earlier cue for bearish activity, however, is a H1 price close beneath the head and shoulders top neckline and bordering trendline supports; breakout selling here might draw the yellow metal towards H1 Quasimodo support noted above at $1,903.
Source: TradingView
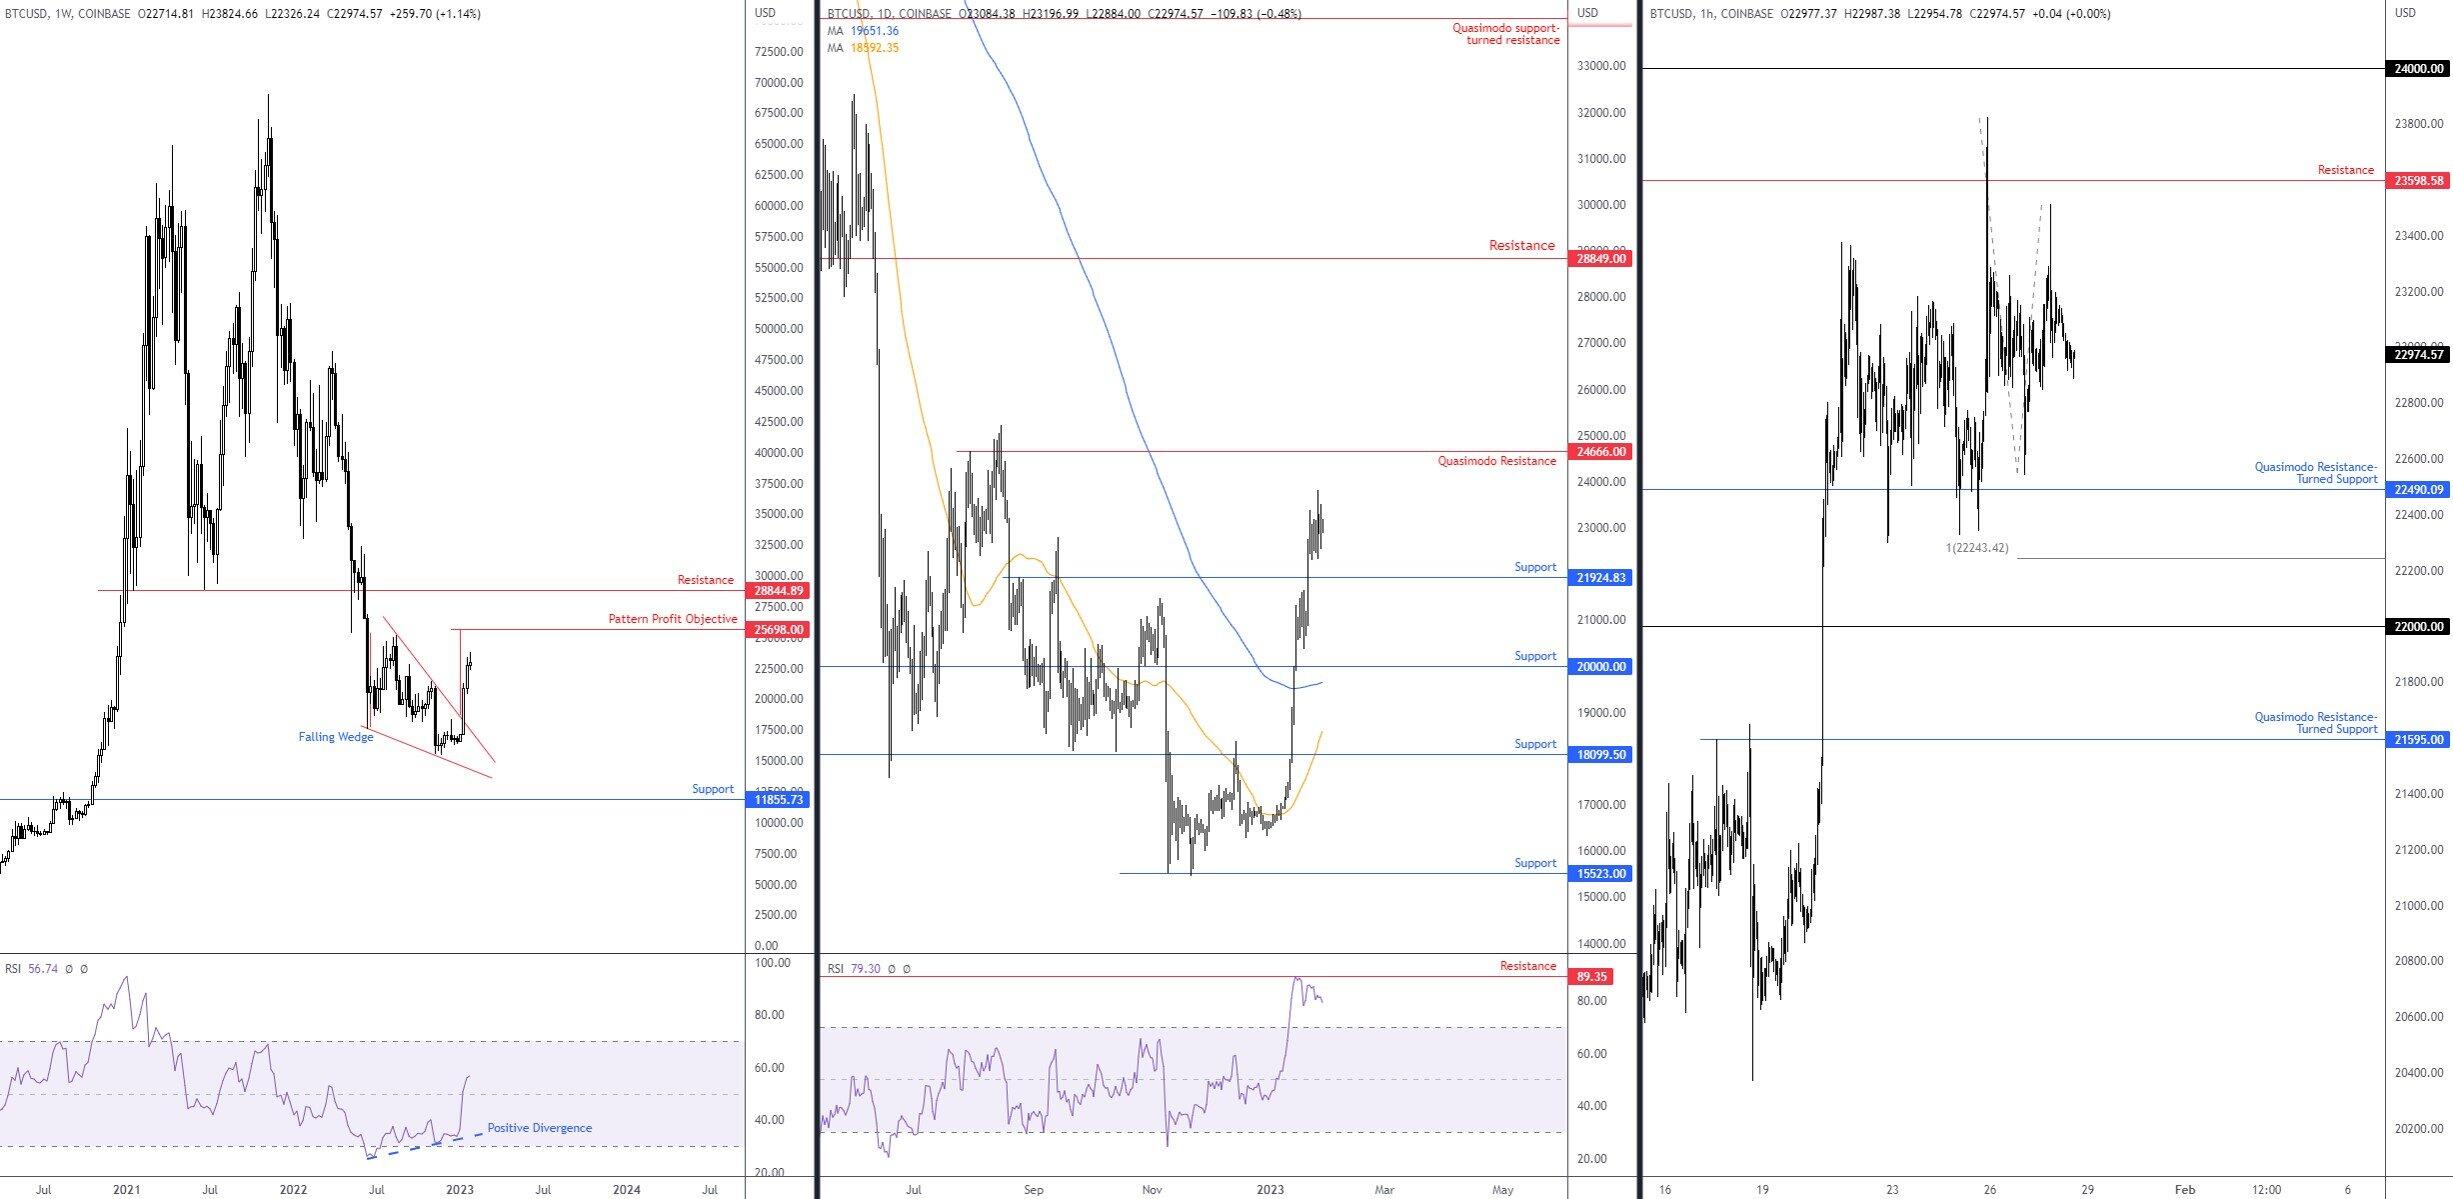
BTC/USD
The major crypto struggled to build on the previous week’s momentum, adding a little more than 1.0% at the close of trading on Friday. Month-to-date performance, nevertheless, deserves notice. Up an eye-popping 39.0%, its largest one-month gain since October 2021, technical elements on the weekly timeframe favours additional outperformance. In the company of the Relative Strength Index (RSI) voyaging north of its 50.00 centreline (followed by positive divergence), BTC/USD appears poised to target a falling wedge (between $25,214 and $17,567) pattern’s profit objective at $25,698, closely trailed by resistance at $28,844.
The daily timeframe has presented limited change since the last Weekly Market Briefing; therefore, the following may serve as a reminder of where the team left the daily scale (italics):
The daily timeframe shows the price of the major cryptocurrency convincingly scaled through resistance at $21,924, which is now marked as support. As of writing, the unit has overthrown the $22,800 13 September high (2022) which could pave the way for follow-through buying to as far north as Quasimodo resistance at $24,666. Note that this level is arranged just south of the weekly timeframe’s falling wedge pattern profit objective at $25,698. But it needs to be noted that while the weekly timeframe’s RSI is exploring above its 50.00 centreline, the daily chart’s RSI confronted indicator resistance at 89.35, testing levels not seen since the beginning of 2021 (indicating a potential bearish move/correction). Still, on the daily scale, we can see that the recent outperformance in early January forged a fresh higher high (breaking the $18,385 14 December high), and crossed above both the 50-day and 200-day simple moving averages, currently trading at $18,592 and $19,651, respectively. Consequently, the trend is showing early signs of an upside reversal.
Out of the H1 timeframe, price action is contained between resistance from $23,598 and support coming in at $22,490, shaped by way of a Quasimodo resistance-turned support. The latter, as you can see, has withstood a number of downside attempts since 21 January, while the aforesaid resistance welcomed sellers on Wednesday and forged a V-shaped rejection. Outside of the noted areas, interest falls on $24,000 and a 100% AB=CD projection at $22,243, followed by $22,000.
Given the bigger picture showing room to manoeuvre to the upside, a correction back to the Quasimodo resistance-turned support at $22,490 and nearby 100% AB=CD projection at $22,243 on the H1 could be enough to draw in buyers and push higher.
Source: TradingView
Author

Aaron Hill
FP Markets
After completing his Bachelor’s degree in English and Creative Writing in the UK, and subsequently spending a handful of years teaching English as a foreign language teacher around Asia, Aaron was introduced to financial trading,


