Italy’s Coronavirus End in Sight?
The markets fell after the Fed took its first massive shot across the bow into Sunday, March 15, then barely reacted to the ultimate unlimited quantitative easing pledge to follow. They’re finally rebounding for the past two days, on news of the $2 trillion fiscal stimulus bill just agreed on early this morning with $4 trillion in Fed loans to boot.
That may not be enough.
Seeing an end to the present acceleration outside of China would be the strongest factor for that sustainable bear market bounce that occurs after the first 40%+ bubble crash.
There was a doctor that did see the China surge in Covid-19 slowing down before everyone else – because he saw the rate of daily case growth slowing even though the total numbers kept piling up and looking bleak…
He must have had some understanding of the S-Curve, which is the pattern that most exemplifies how new technologies, technologies, social behaviors or viruses move into a population. It is the key to measuring an exponential growth process, which this clearly is.
To demonstrate, I take the country that best handled this and has already seen the virus recede totally: South Korea. And it did indeed follow that classic S-Curve pattern in the growth of total infections.
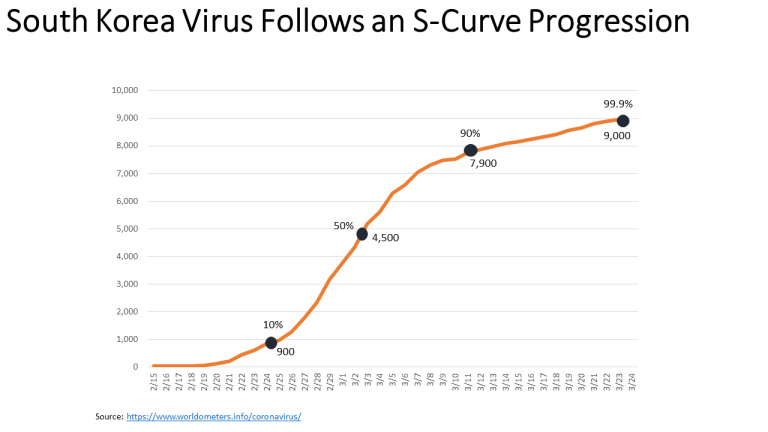
You can see here that the 10% acceleration point was between February 24 and 25 at around 900 cases. It hit the maximum growth rate just after March 2 at around 4,500 cases. Then it hit the end of the acceleration phase at 90% between March 9 and 10 at 7,900 (8,100 would have been the projection). It then grows much lower into a 99.9% peak around March 24, and today is at around 9,000 (right on projection).
The clearest point to project is at the 50% mark as you can measure when the daily growth is peaking – as it did between Feb 29 and March 3, closest to March 2.
So now we look at Italy, the epicenter of the virus’ European explosion. Seeing Italy slow down markedly would be the most important factor for stocks to mount that 3-5-month+ bear market rebound that will give us the best prices to exit going forward, and to get fully into the safe haven T-bonds and other investments to thrive in the great depression ahead.
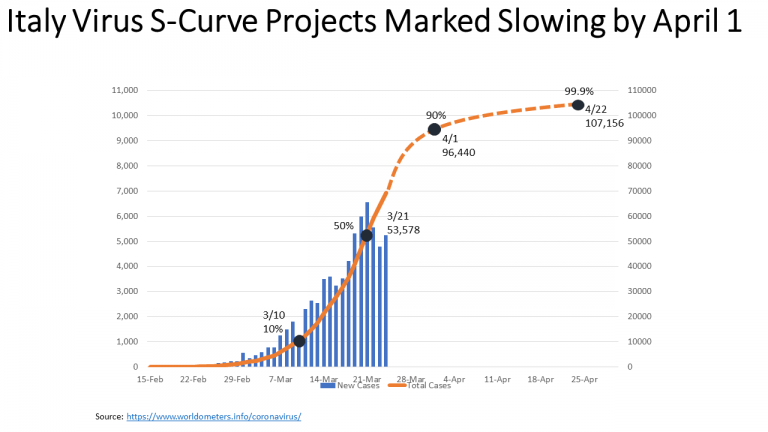
I have been watching this chart the most closely, and have been looking for when the daily cases (in bars) look like they are peaking. That clearly now looks like March 21 as there have been three days of lower advances into March 24. That puts the 50% penetration point at around 53,578 which projects 96,440 at 90% around April 1 when the acceleration phase is over and a marked slowing will become increasingly obvious. The total cases should mature at 99.9% at around 107,156 with around 12,000 deaths by April 23 when Italy will look like China today – ready to get back to work and life.
Somewhere between April 2 and mid-April, the markets should see an end to the worst acceleration and highest death rate in Europe. That should see a bottom to this first 40%+ crash, if not before – and that would parallel the 40% first crash in two months between March 24 and May 24.
Another S-Curve insight. The VIX (volatility index) looks to have peaked at 85 on March 18 and could represent the 50% point of this crash and project a bottom (one more wave down) into around April 15. Correlations with the first Nasdaq crash in 2000 would also correlate and my S&P 500 target of around 2,080 would be the best for a final bottom to this first crash down about 39%. I will discuss this scenario more in my March Conquer the Crash video by next Tuesday.
The second worst country in Europe is Spain, which appears to be about three or four days behind Italy but hasn’t seemed to hit 50% quite yet, but could be as soon as tomorrow. It projects to 100,000+ in total infections but with lower deaths of around 8,000+.
France, Germany and the U.K. are still in the pre-50% stage and are still growing rapidly… but Italy’s slowdown should mark the beginning of most slowing just ahead as well.
The big trend now is the explosion in New York City, with HALF of the 55,000 total U.S. infections today. Recent tests showed that of people tested, there was a 28% positive testing vs. 8% average for the U.S. The “attack rate” is 1/1000, or five-times normal. That’s alarming!
New York is the most dense and largest city in the U.S. and in colder weather, hence, it would be the most dangerous.
I will be tracking New York for when it appears to hit this more predictable 50% point… let’s hope it’s not a lot higher as the total projected infections and deaths will be double that rate.
Good news: the death rate in the U.S. is currently only around 1.2% vs. 9.5% in Italy and 4.4% globally.
Author

Harry S. Dent, MBA
Dent Research
Harry S. Dent Jr. studied economics in college in the ’70s, but found it vague and inconclusive. He became so disillusioned by the state of his chosen profession that he turned his back on it.


