Intermediate Topping Process Continues
Market Overview
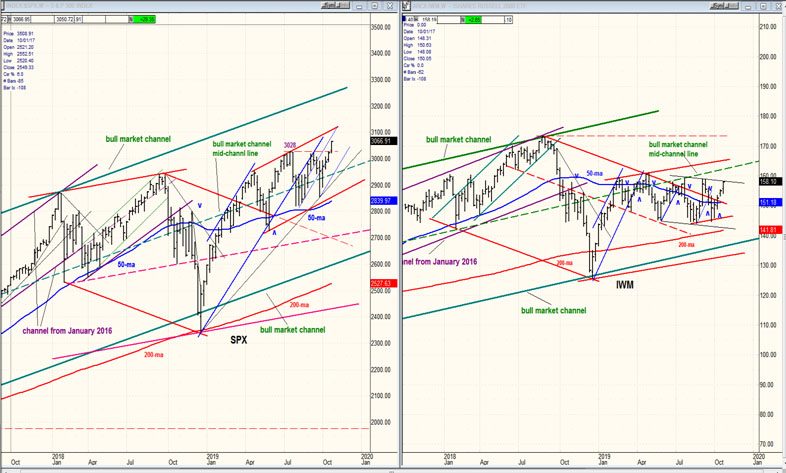
Last week SPX and NDX made a new all-time high. DJIA failed to do so by a small margin. NYA (the broadest index) remained well below its January 2018 high. And, of course, IWM clearly remains in a 14-month downtrend. It’s obvious that the stock market, as a whole, is a mixed bag. If it were trying to re-establish it’s long-term uptrend, IWM and NYA would be leading and not lagging. We should therefore conclude that it must, instead, be forming a top of at least intermediate proportion which will be followed by a correction proportional to the degree of distribution which is currently taking place.
It may be time to consider that the 40-week cycle did make its low right on schedule, on 10/03/19, exactly 40weeks from its previous low of 12/26/18. The December low ended a correction of 594 points! By contrast, the recent cycle low only produced a decline of 172 points and prices have been pushing up ever since. It is understandable that such a comparatively mild correction should have created some skepticism regarding whether or not the low had been seen. However, the persistent uptrend since 2856 should be an indication that the 40-week cycle is back in an up-phase. Until a sudden, sharp decline proves otherwise – in the near future, this should be our current assumption.
Based on that premise, how much higher will we go, and how much longer will it take to bring about the final uptick to the current uptrend? We have two ways to determine this! Neither can produce an exact answer butonly an approximate one. However, together they suggest that we could already have arrived! Eric Hadik (Insiidetracktrading.com) is calling for a cluster of cycle tops between November 1-15. The SPX Point&Figure chart made a congestion pattern low in late August which called for a move to ~3060. In early October, the index appeared to produce a confirmation pattern leading to the same projection. On Friday, SPX closed at 3066.72. Consequently, based on theseballpark projections, we could already have arrived! (If we keep on going, the next projection would be ~3110).
Needless to say, the next couple of weeks will be watched closely to see if this time/price projection is correct. Assuming that it is, what kind of a correction can we expect to see? The 40-wk cycle would now be only four weeks along, and if we start a decline, it will put on the brakes preventing a sharp decline from taking place but instead, a gradual one. This scenario would provide substance to the rounding top theory that I have been suggesting. If so, we could start slow and, several months down the line, as we approach the low of the correction, accelerate into it.
Market Analysis (All charts are courtesy of QChart)
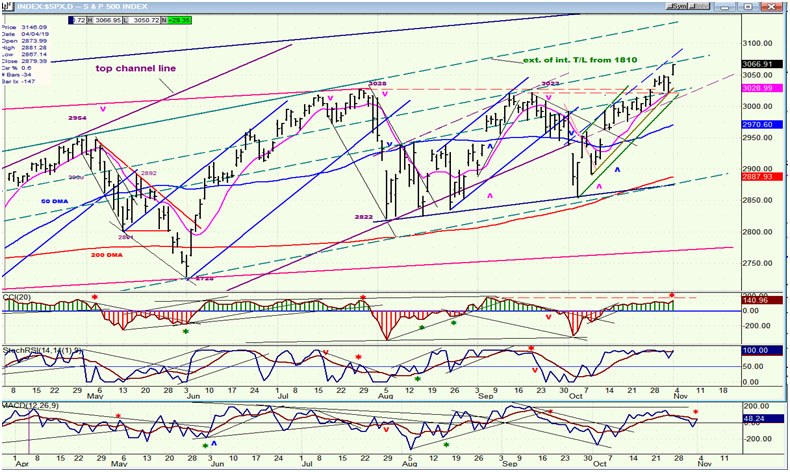
SPX daily chart
On Wednesday, the SPX made a short-term high and pulled back on Thursday, found support on a trend line and the 9-dma, and made a new high on Friday. This keeps the daily uptrend going! As stated above, the P&F projection taken on a 10-point chart calls for approximately 3060. In order to reverse its trend, the index would have to close below 3020 -- which is now a strong support level. Therefore,even if we have seen the rally high, it is likely that a congestion pattern would form above 3020 before rolling over.
There is some divergence on the CCI between the current high and the 3022 high which occurred six weeks ago. That divergence is more pronounced on the A-D oscillator, at the bottom of the chart. There is no divergence on the SRSI; it is simply overbought. This suggests a potential top in the making, but the oscillators will all have to turn down to signal the start of a downtrend.
What is needed to confirm that a top is in place and that a decline has started is crystal clear, and we must wait until it takes place. Also, the market action must prove that it is not capable of moving to 3100 before reversing.
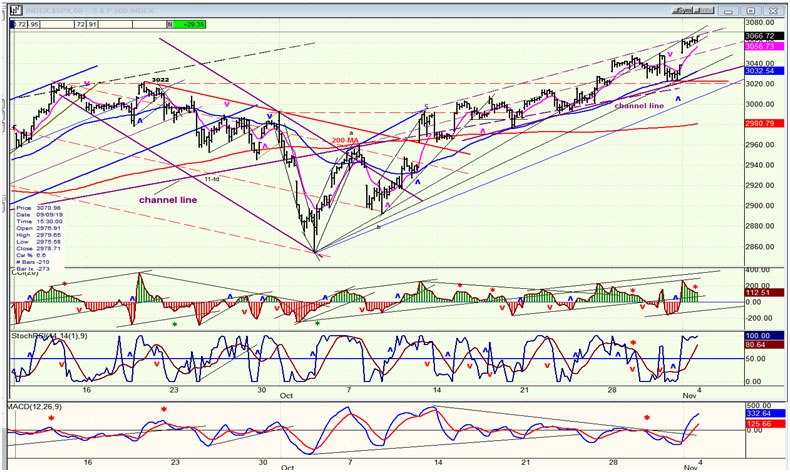
SPX hourly chart
The hourly chart provides an opportunity for closer scrutiny about what the SPX is doing. On this chart, the daily trend is reduced to a rising channel which has now moved well beyond ifs former high of 3022. This small channel appears to be built on the lower trend line of the larger, daily channel which is providing support. To put an end to this trend, we would need to break below 3020 and keep going. That would not only break that support, but it would also halt and reverse the sequence of short-term higher highs and higher lows which define the current uptrend.
Friday’s action suggests that we met some resistance at the top line of the small channel since, after the opening surge, the index continued to trade below it; although the push higher at the close, and the lack of clear divergence in the oscillators leaves Monday’s opening in doubt.
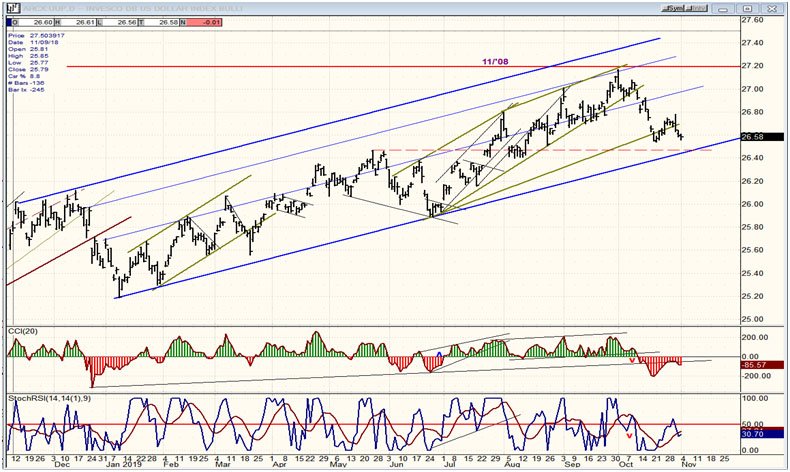
UUP (dollar ETF) daily
If UUP moves a little lower, it will find support on the blue channel line and the dashed red line. This would almost ensure a rebound, butfailure to go past 27.00 would likely entail a break to a lower level. The weekly chart suggests that an intermediate correction has started.
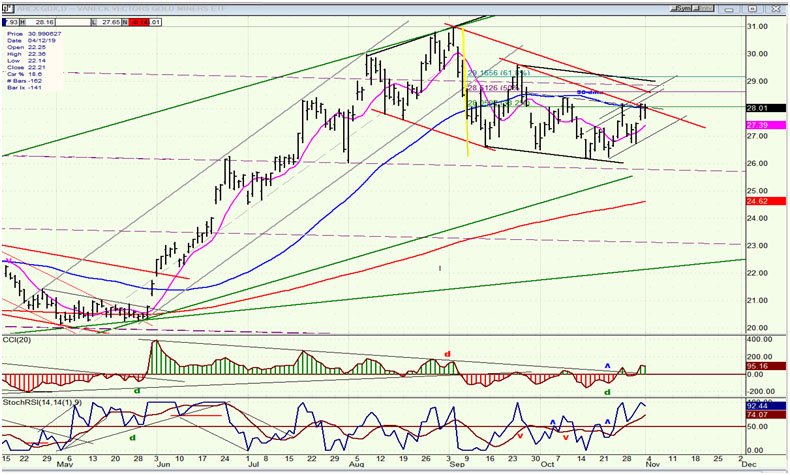
GDX (Gold miners ETF) weekly
GDX should be able to extend its current rally to about 28.50-29.00 before running into resistance. If it does not meet with heavy selling at that level, based on the P&F chart formation,the move can extend to as high as 34.00.
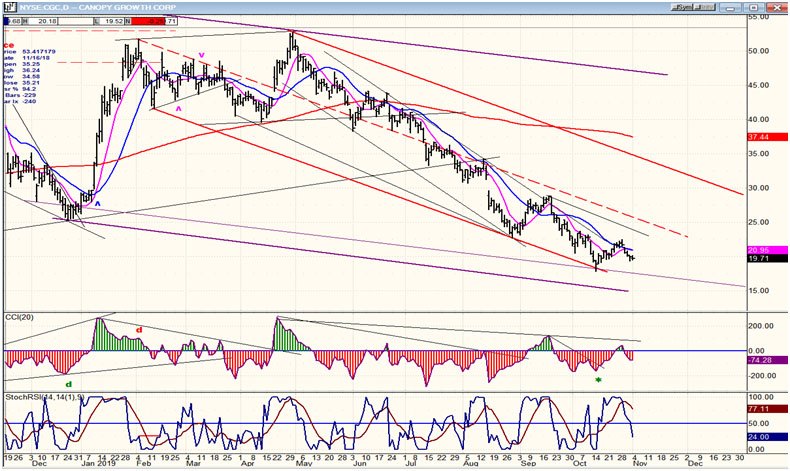
CCG (canopy growth) daily
CGC found support at the bottom of its red channel. After an initial bounce, it may be re-testing its low. If that low holds, the next move could be to the mid-channel dashed red line.
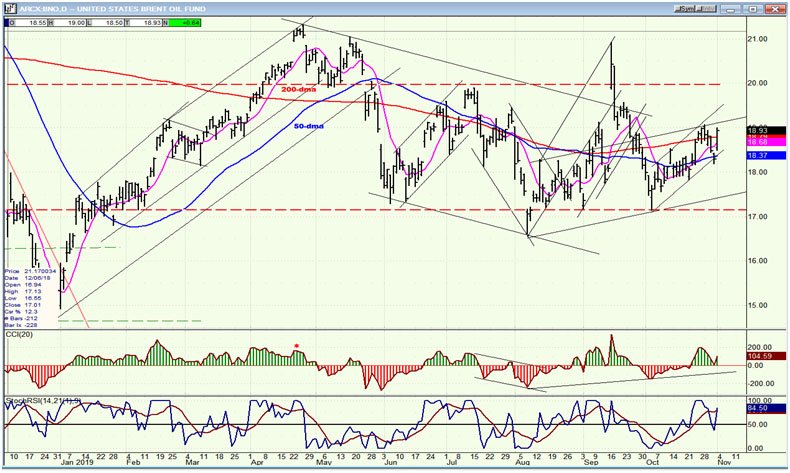
BNO (U.S. Brent oil fund) daily
BNO is rallying with the market. When the market rolls over, so will BNO.
Summary
In spite of some additional short-term strength to a new all-time high which is primarily driven by strength in the NDX, SPX is most likely putting the final touch on a large intermediate top.
Author

Andre Gratian
Market Turning Points
When I was a stock broker years ago, a friend introduced me to technical analysis of the market and it is not an exaggeration to say that I fell in love with this approach! Ever since then, it has become an increasingly important


