![]()
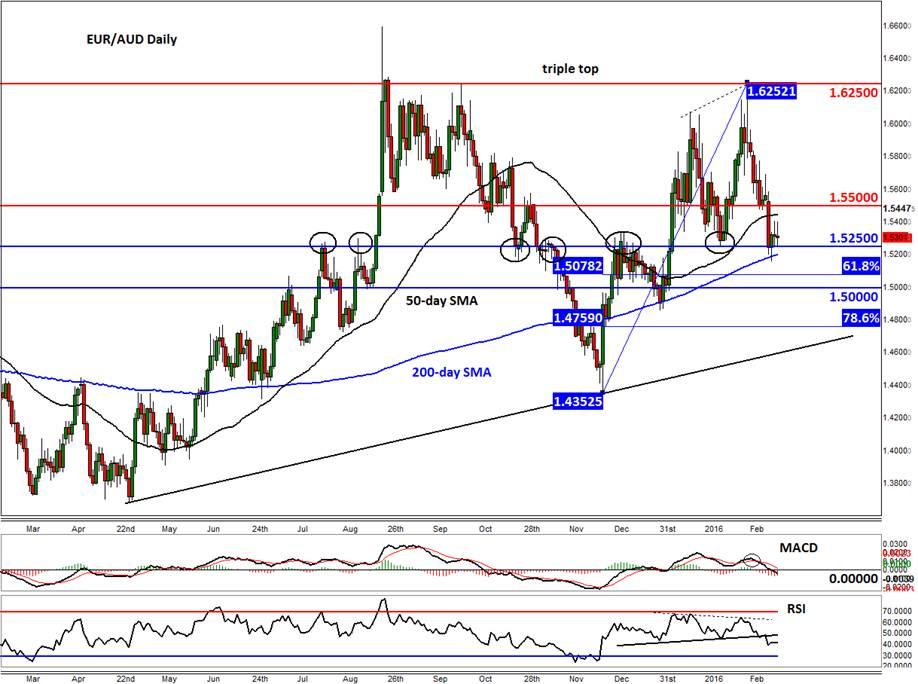
Below we have a daily chart of the EUR/AUD. Similar to the EUR/USD, consolidation is the name of the game. But within the consolidation, it looks like a new trend is emerging, at least for the EUR/AUD anyway. There are lots of factors to observe in this chart.
Let’s start with the secondary indicators first. The MACD is trending lower below its signal line and is moving below zero. Meanwhile, the RSI – having already formed bearish divergence – has broken below a short-term bullish trend and is moving towards 40 – below here would point to downward momentum. So, both of these momentum indicators are pointing to a breakdown in the underlying EUR/AUD currency pair.
Meanwhile the 50 and 200 daily moving averages are getting close to one another, too. And with the 50-day SMA flattening, this points to a potential “death crossover” soon. When the 50 is below the 200 SMA, some momentum traders would like to fade the rallies rather than buy the dips. For now however, they are still in the “right” order, so we shouldn’t jump into any conclusions.
The study of price action itself is, as ever, the most important indicator. On this front, the EURAUD’s repeated failure to rally above 1.6250 since August of last year, suggests price has formed a top; more precisely, a triple top reversal pattern. The last attempt to break above 1.6250 ended with the formation of a very nice doji candle at the highs. There, the RSI was also in a state of bearish divergence. Obviously hindsight is a wonderful thing, but the power of the rejection there can still be ‘felt’ – look, for example, at how aggressively price has moved lower following that rejection.
At the time of this writing, the EUR/AUD was hovering around the pivotal 1.5250 level, which had been strong support and resistance in the past. Price was also holding above the 200-day SMA. The hesitation here is not a major surprise given the extent of the downward move we have seen already. Put another way, bearish speculators are probably taking some profit here. But the lack of a significant bounce so far suggests that price may break further lower over the coming days.
If the EUR/AUD breaks down as the above technical indications suggest, the next potential bearish targets could be the 61.8% Fibonacci retracement at 1.5080, followed by the psychologically-important 1.50 handle and then the bullish trend line at around 1.4750. This technical bearish setup would become invalid in the short-term if resistance at 1.5500 breaks on a daily closing basis. The longer term outlook would still remain bearish for as long as price holds below the 1.6250 ceiling.
Finally, given the growing divergence of monetary policy stance between the RBA and the ECB, the fundamentals meanwhile also point to lower levels for the EUR/AUD – especially if the ECB decides to expand its QE programme in March.
Trading leveraged products such as FX, CFDs and Spread Bets carry a high level of risk which means you could lose your capital and is therefore not suitable for all investors. All of this website’s contents and information provided by Fawad Razaqzada elsewhere, such as on telegram and other social channels, including news, opinions, market analyses, trade ideas, trade signals or other information are solely provided as general market commentary and do not constitute a recommendation or investment advice. Please ensure you fully understand the risks involved by reading our disclaimer, terms and policies.
Recommended Content
Editors’ Picks
EUR/USD edges lower toward 1.0700 post-US PCE

EUR/USD stays under modest bearish pressure but manages to hold above 1.0700 in the American session on Friday. The US Dollar (USD) gathers strength against its rivals after the stronger-than-forecast PCE inflation data, not allowing the pair to gain traction.
GBP/USD retreats to 1.2500 on renewed USD strength

GBP/USD lost its traction and turned negative on the day near 1.2500. Following the stronger-than-expected PCE inflation readings from the US, the USD stays resilient and makes it difficult for the pair to gather recovery momentum.
Gold struggles to hold above $2,350 following US inflation

Gold turned south and declined toward $2,340, erasing a large portion of its daily gains, as the USD benefited from PCE inflation data. The benchmark 10-year US yield, however, stays in negative territory and helps XAU/USD limit its losses.
Bitcoin Weekly Forecast: BTC’s next breakout could propel it to $80,000 Premium

Bitcoin’s recent price consolidation could be nearing its end as technical indicators and on-chain metrics suggest a potential upward breakout. However, this move would not be straightforward and could punish impatient investors.
Week ahead – Hawkish risk as Fed and NFP on tap, Eurozone data eyed too

Fed meets on Wednesday as US inflation stays elevated. Will Friday’s jobs report bring relief or more angst for the markets? Eurozone flash GDP and CPI numbers in focus for the Euro.
