![]()
Unless you’ve been living under a rock, you’re aware of this month’s incredible rally in the US Dollar. While some currencies like the euro, yen, and New Zealand dollar are testing multi-year lows against the greenback, other currency pairs have seen more limited appreciation in the world’s reserve currency; for traders who expect the buck’s rally to continue, these currency pairs may offer good trade opportunities as they “catch up” with their rivals.
A prime example is USDCAD. The North American pair has rallied for eight consecutive days, reaching a 6-month high above 1.1200 in the process. Today’s move was driven by two catalysts in particular:
1. Weak Canadian GDP – While it is not the most up-to-date report on economic activity in the Great White North, this morning’s release of Canada’s July GDP figure showed that economic activity was flat m/m, below expectations of a 0.2% rise. The lackluster growth, especially when the US economy appears to be accelerating, spooked CAD bulls and drove the loonie lower.
2. A sharp drop in oil prices – after showing nascent signs of bottoming earlier this week, the floor dropped out of oil prices, driving WTI down more than 3 points to trade at $91.00. It’s difficult to pin today’s drop on any one catalyst, though news that OPEC increased its output to a 2-year high this month likely played a role in the drop. Oil is Canada’s top export, and a drop in the price of “black gold” has a direct impact on Canada’s economic growth.
Technical View: USDCAD
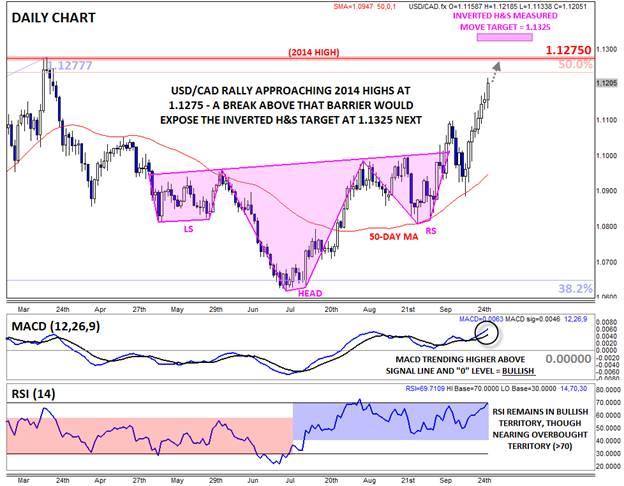
We’ve been generally constructive on USDCAD for the last two weeks (see “USDCAD: Spoiled Dollar Bulls Not Impressed By Strong Retail Sales” for more). As a reminder, the pair carved out a clear inverted Head-and-Shoulders pattern over the course of the summer, and rates have been consistently finding support at the 50-day moving average for the past two months.
At the same time, the secondary indicators are also painting a bullish picture. The MACD indicator continues to trend higher above its signal line and the “0” level, showing strongly bullish momentum. Similarly, the daily RSI has been in bullish territory (>40) for ten weeks now, and though the indicator is currently pressing against overbought territory, the lack of nearby price resistance levels suggests the pair could still run further before pulling back.
Speaking of resistance levels, the next area that the bulls will look to target could be the 2014 high at 1.1275, especially if this week’s US data comes out strong. The inverted Head-and-Shoulders pattern’s measured move target comes in above that barrier at 1.1325. Any dips that emerge are likely to find support at the 50-day MA (currently 1.0950 and rising), and the medium-term bullish bias will remain intact as long as rates hold above that support area.
Source: FOREX.com
General Risk Warning for stocks, cryptocurrencies, ETP, FX & CFD Trading. Investment assets are leveraged products. Trading related to foreign exchange, commodities, financial indices, stocks, ETP, cryptocurrencies, and other underlying variables carry a high level of risk and can result in the loss of all of your investment. As such, variable investments may not be appropriate for all investors. You should not invest money that you cannot afford to lose. Before deciding to trade, you should become aware of all the risks associated with trading, and seek advice from an independent and suitably licensed financial advisor. Under no circumstances shall Witbrew LLC and associates have any liability to any person or entity for (a) any loss or damage in whole or part caused by, resulting from, or relating to any transactions related to investment trading or (b) any direct, indirect, special, consequential or incidental damages whatsoever.
