![]()
Just like the past few days, gold is once again weighed down by the deadly combination of stronger dollar and US equities. The greenback’s strength is bizarre given the big disappointment we had in terms of housing market data as new home sales plunged in June from an already low base the month before. Sales of new homes dropped to 406,000 annualised units in June from 442,000 in May (the original estimate for May was 504,000). This represents a more-than-eight percent drop from the revised figure. On top of this, the initial or flash version of the US manufacturing PMI was also weaker than expected, printing 56.3 for July compared to 57.5 expected and June’s reading of 57.3. However it wasn’t all doom and gloom, for the weekly unemployment claims fell by 19 thousand applications to 284,000 which was the lowest level since February 2006! Also weighing down the safe haven gold price was the stronger PMI readings that came out of China and Europe earlier, which boosted the appetite for riskier assets such as equities. Meanwhile the demand for gold from China has not been strong enough recently, while the Indian government has ruled out an imminent easing of import restrictions there. According to the China Gold Association, demand for the yellow metal fell by 19% in the first half of the year compared to the same period in 2013. While the already-robust jewellery demand climbed by an additional 11%, this was not enough to offset a 62% plunge in demand for gold bars. In the meantime, China’s gold production increased by 9.5% in the first half of 2014. With demand from the world’s top two gold consumers apparently not robust enough, it is difficult to see how prices can recover from these levels in any meaningful way.
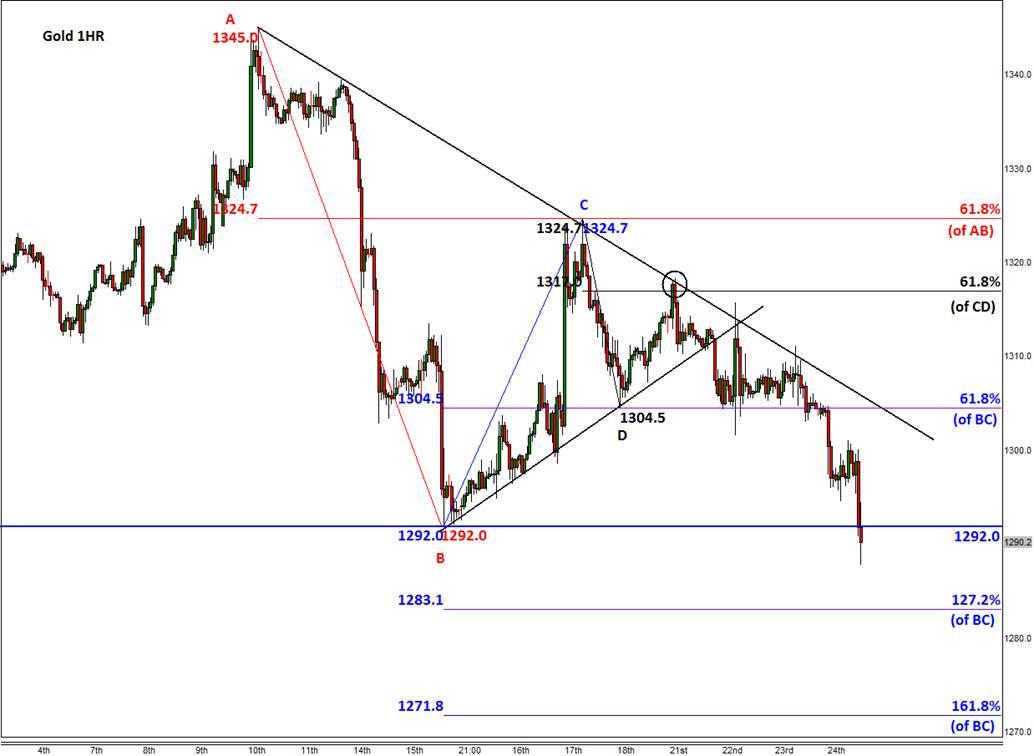
Nevertheless, gold remains a popular trading asset for short-term speculators, particularly those who like technical analysis. Earlier this week, we analysed how well gold prices react around Fibonacci levels, aptly calling it “Gold’s love affair with Fibonacci.” As a reminder, it is the 61.8% retracement and the 161.8% extension levels that have been providing the most profound support and resistance in recent past. As can be seen from Monday’s article, we put a circle around $1317 to suggest that this was a key technical level in terms of Fibonacci analysis. Not only did $1317 correspond with the 61.8% retracement level, it also tied in with a bearish trend line which made it a key resistance level. Sure enough, gold touched that level before drifting lower ever since as the updated 1-hour chart shows, below. This is another example to prove that gold’s love for Fibonacci is pure. Now, sticking with the same chart and we can see that the 127.2 and 161.8 percent extension levels of the BC swing comes in at $1283 and $1272.
Figure 1:
Source: FOREX.com.
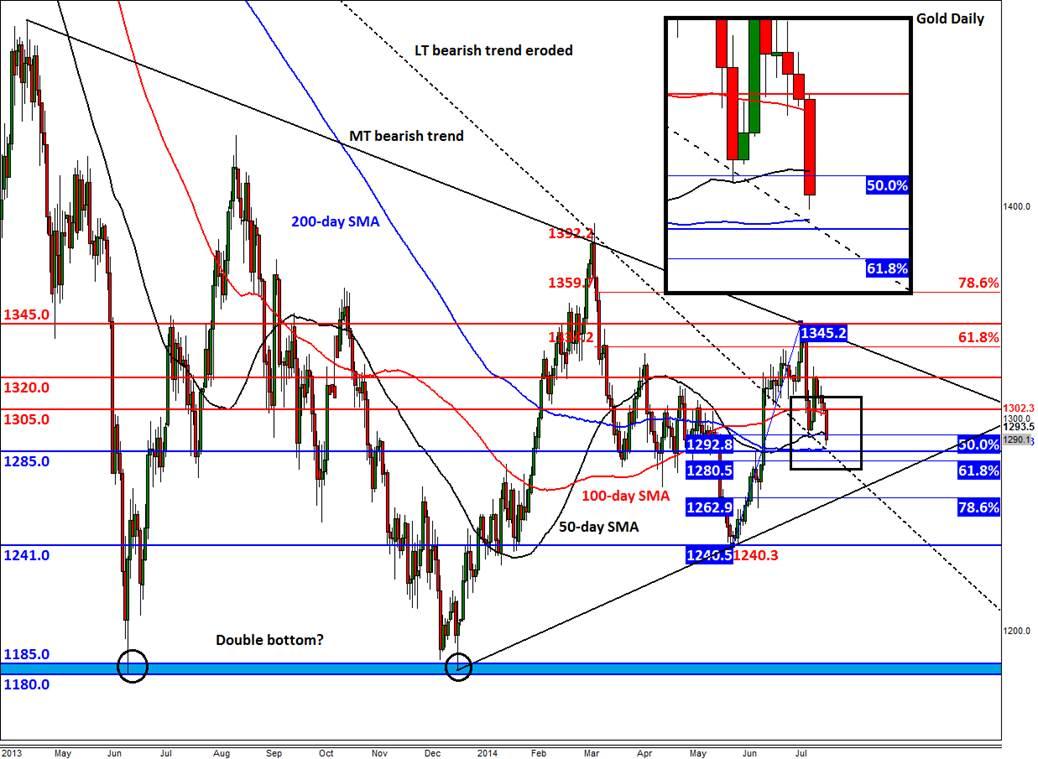
But looking at the daily chart and we can see there are several other technical levels which could also provide some support. The 200-day moving average, for one, comes in at $1286 – a dollar ahead of the broken resistance at $1285. This makes $1285/6 a key support area and so I wouldn’t be surprised if the metal bounces there, and in doing so prevent price from reaching the $1272 support level I mentioned in the above paragraph. This is why it is a good idea to always look at charts of various time frames when making a trading decision. Meanwhile the 61.8% Fibonacci level of the upswing from the June low comes in at $1280/1. The bears know that they cannot ignore this level given the number of times a 61.8% Fibonacci level has provided support and resistance in the past. On the upside, the first level of resistance to watch is the newly broken support of $1292. Above $1292, the psychological $1300 mark could be the next level to watch, followed by $1305 and $1320. For now, the path of least resistance appears to be on the downside, and until we see a distinct reversal sign our near time technical bias would remain bearish.
Figure 2:
Source: FOREX.com.
General Risk Warning for stocks, cryptocurrencies, ETP, FX & CFD Trading. Investment assets are leveraged products. Trading related to foreign exchange, commodities, financial indices, stocks, ETP, cryptocurrencies, and other underlying variables carry a high level of risk and can result in the loss of all of your investment. As such, variable investments may not be appropriate for all investors. You should not invest money that you cannot afford to lose. Before deciding to trade, you should become aware of all the risks associated with trading, and seek advice from an independent and suitably licensed financial advisor. Under no circumstances shall Witbrew LLC and associates have any liability to any person or entity for (a) any loss or damage in whole or part caused by, resulting from, or relating to any transactions related to investment trading or (b) any direct, indirect, special, consequential or incidental damages whatsoever.

