Huge Volume & Tiny Volume – Meaningful Paradox for Gold Investors

Sometimes the clues one needs to make a very important decision are hidden and not visible at the first sight. Sometimes, they are right in front of one's eyes. Interestingly, at times it's more difficult to notice the obvious ones than the hidden ones, as one views them as something so obvious that it's not worth paying attention to. Today, on the precious metals market, we have both. There is one word that connects them: volume. The devil, however, is in the details.
The volume was tiny. And huge. Your Editor's eyesight could have been better, but it's not the reason behind this paradox. The reason is change is perspectives and parts of the precious metals market. The weekly and daily volume in gold was small, but it was very significant in case of palladium, and both can tell us something about gold's next move.
Let's start today's discussion with the flag metal of the sector – gold.
Gold's Weak Volume
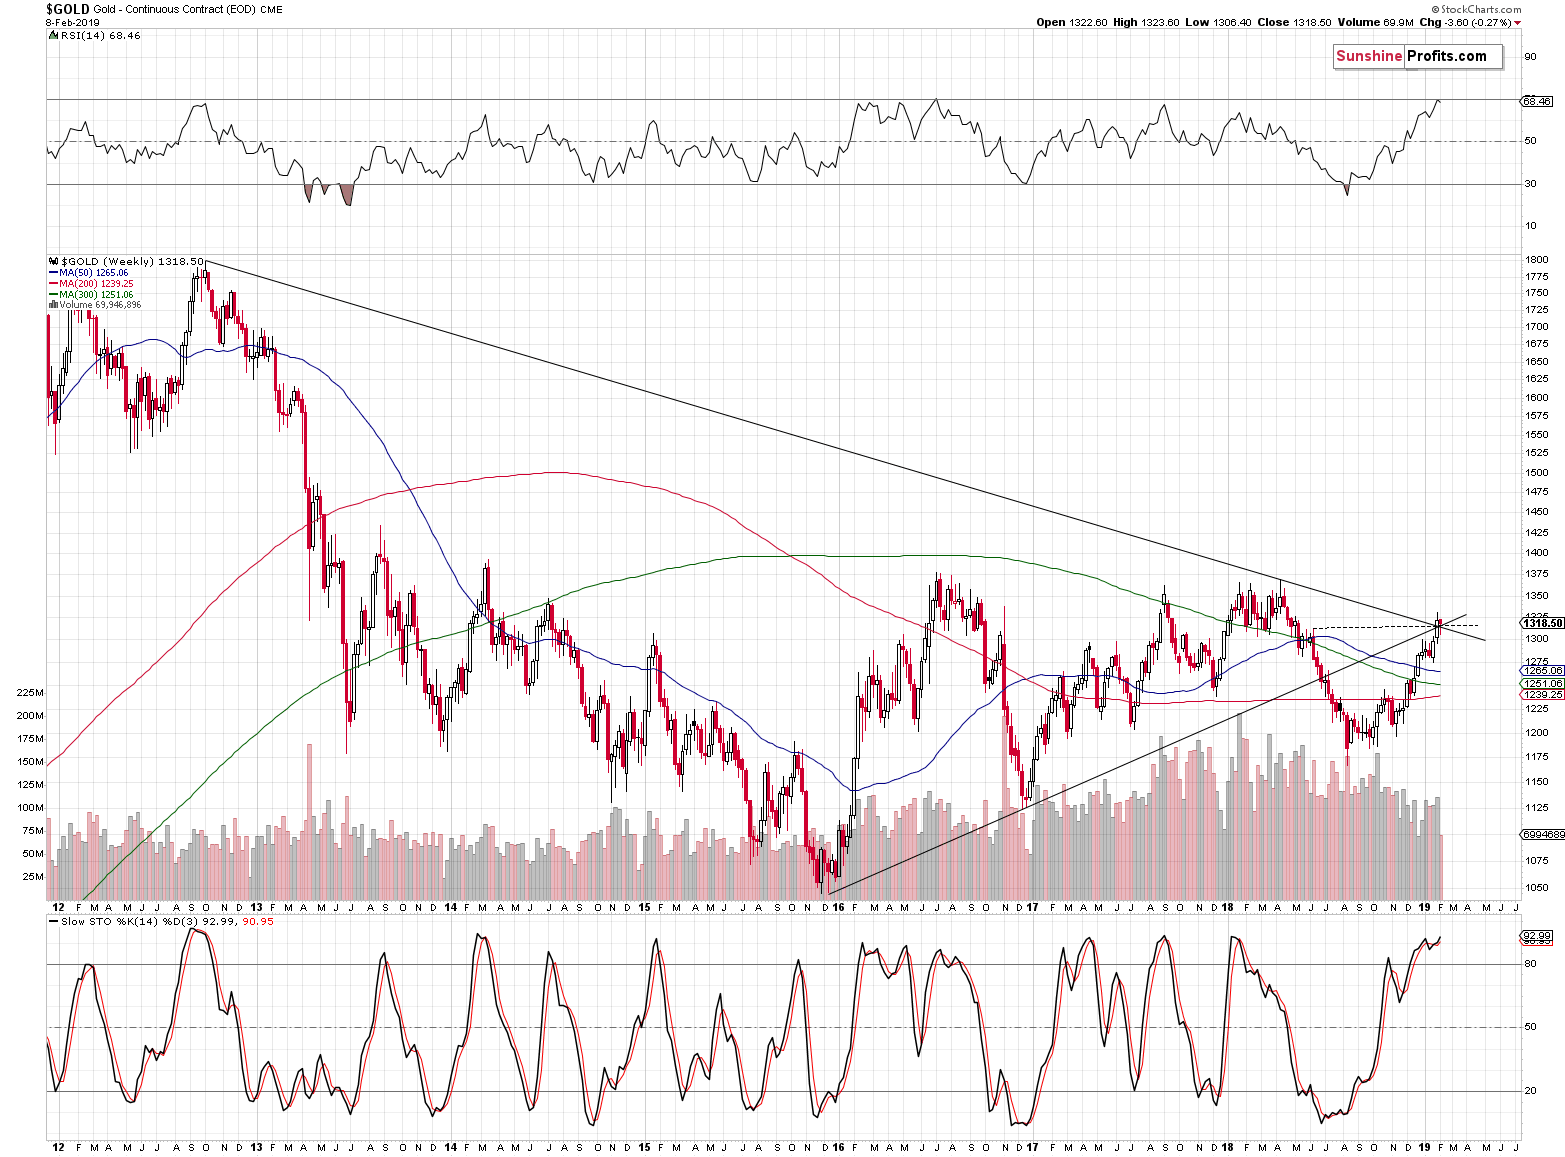
Last week's decline was tiny, but the more shocking fact was the volume that accompanied it. We saw something similar shortly after the previous two major tops, so it seems to be quite normal at the current stage of the gold market. That's simply how gold tends to perform shortly after the top.
Some may say that gold's decline on low volume is a factor that shows that gold doesn't want to move lower. This claim would not be correct because of at least two reasons. One is that the price-volume mechanism is not symmetrical. If there were no buyers and no sellers, the price would decline, not stay at the same level. The implications of low volume are really different for the upswings and for the declines. That's why upswings on low volume are bearish and declines on low volume are rather neutral.
The second reason is that gold didn't decline for the entire previous week – it moved a bit higher on Friday.
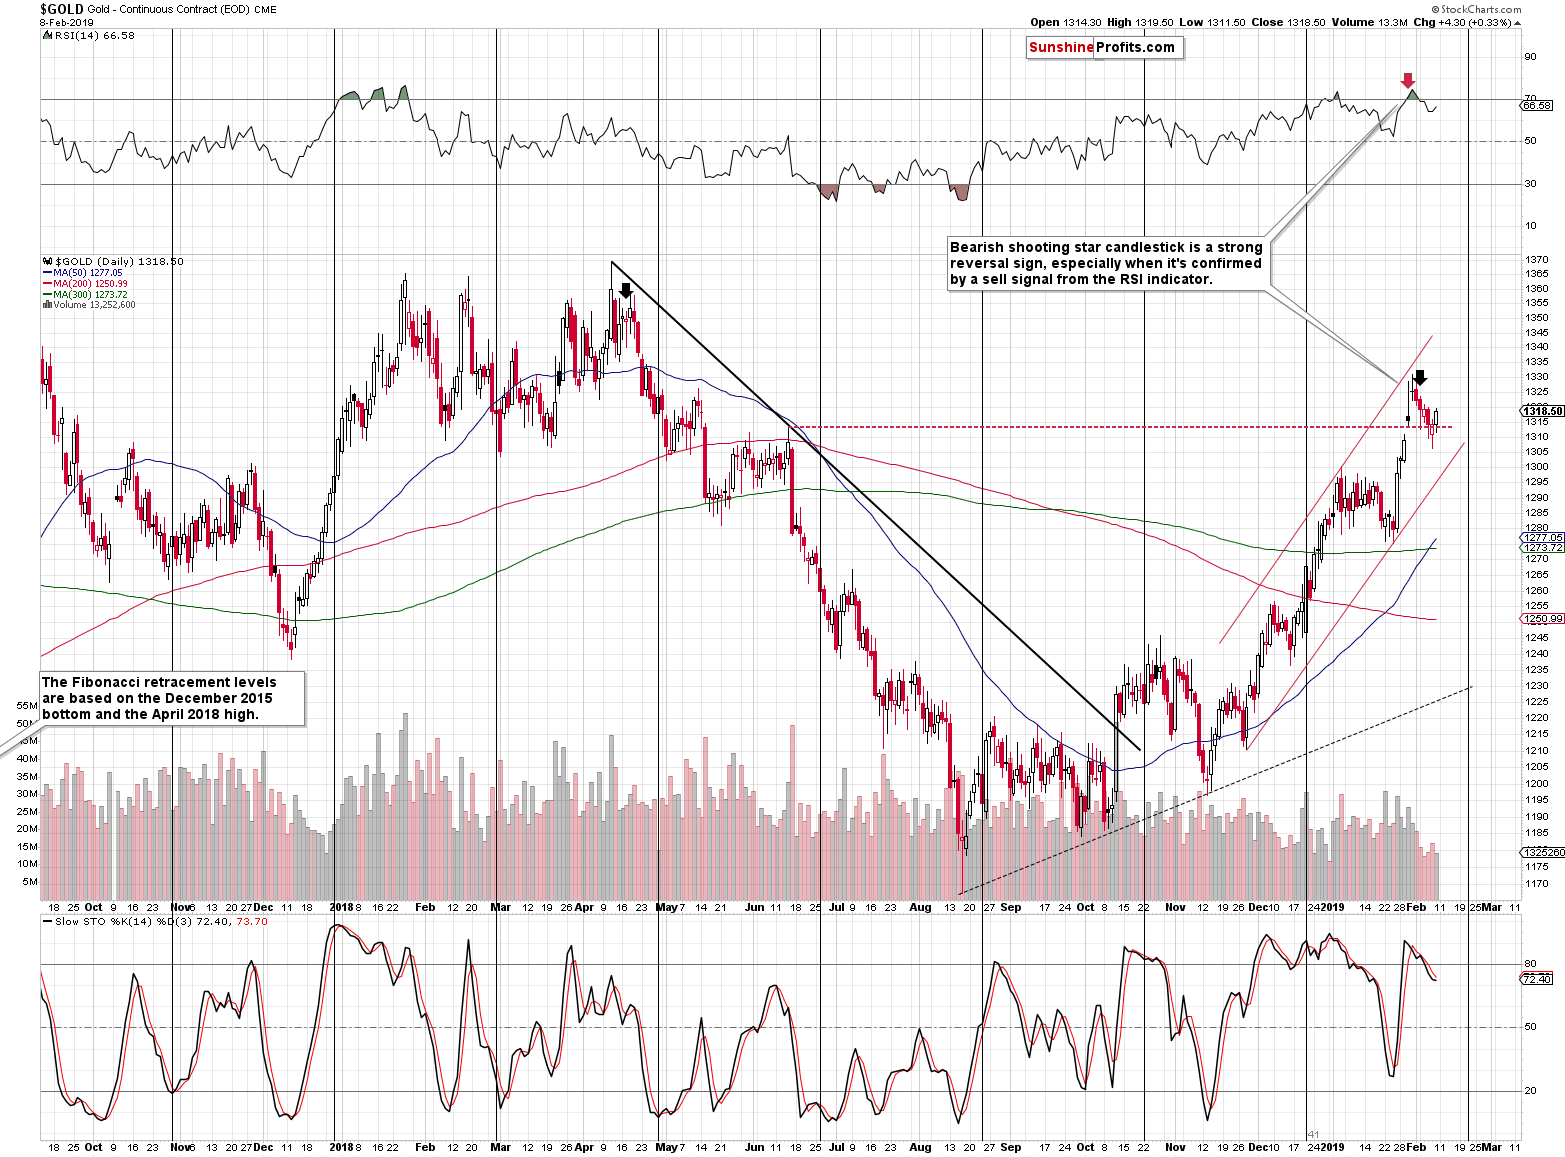
Obviously, the Friday's move higher – on its own – does not prove or indicate anything. The daily volume, on which it moved higher, however, does.
Last week's decline took place on low volume, so many traders viewed it as a counter-trend pullback. However, if that was really the case, then gold should have rallied on Friday on strong volume. The volume was neither strong, nor average. It was weak. This suggests that the decline that we saw earlier last week was not just a pause in buyers' activity. Taken together – both: declines and Friday's rally – show that the buying power has most likely dried up. Everyone (or almost everyone), who was considering purchasing gold around current levels (before seeing an additional downswing) has already entered the market. And the price needs fresh buying power to keep rallying.
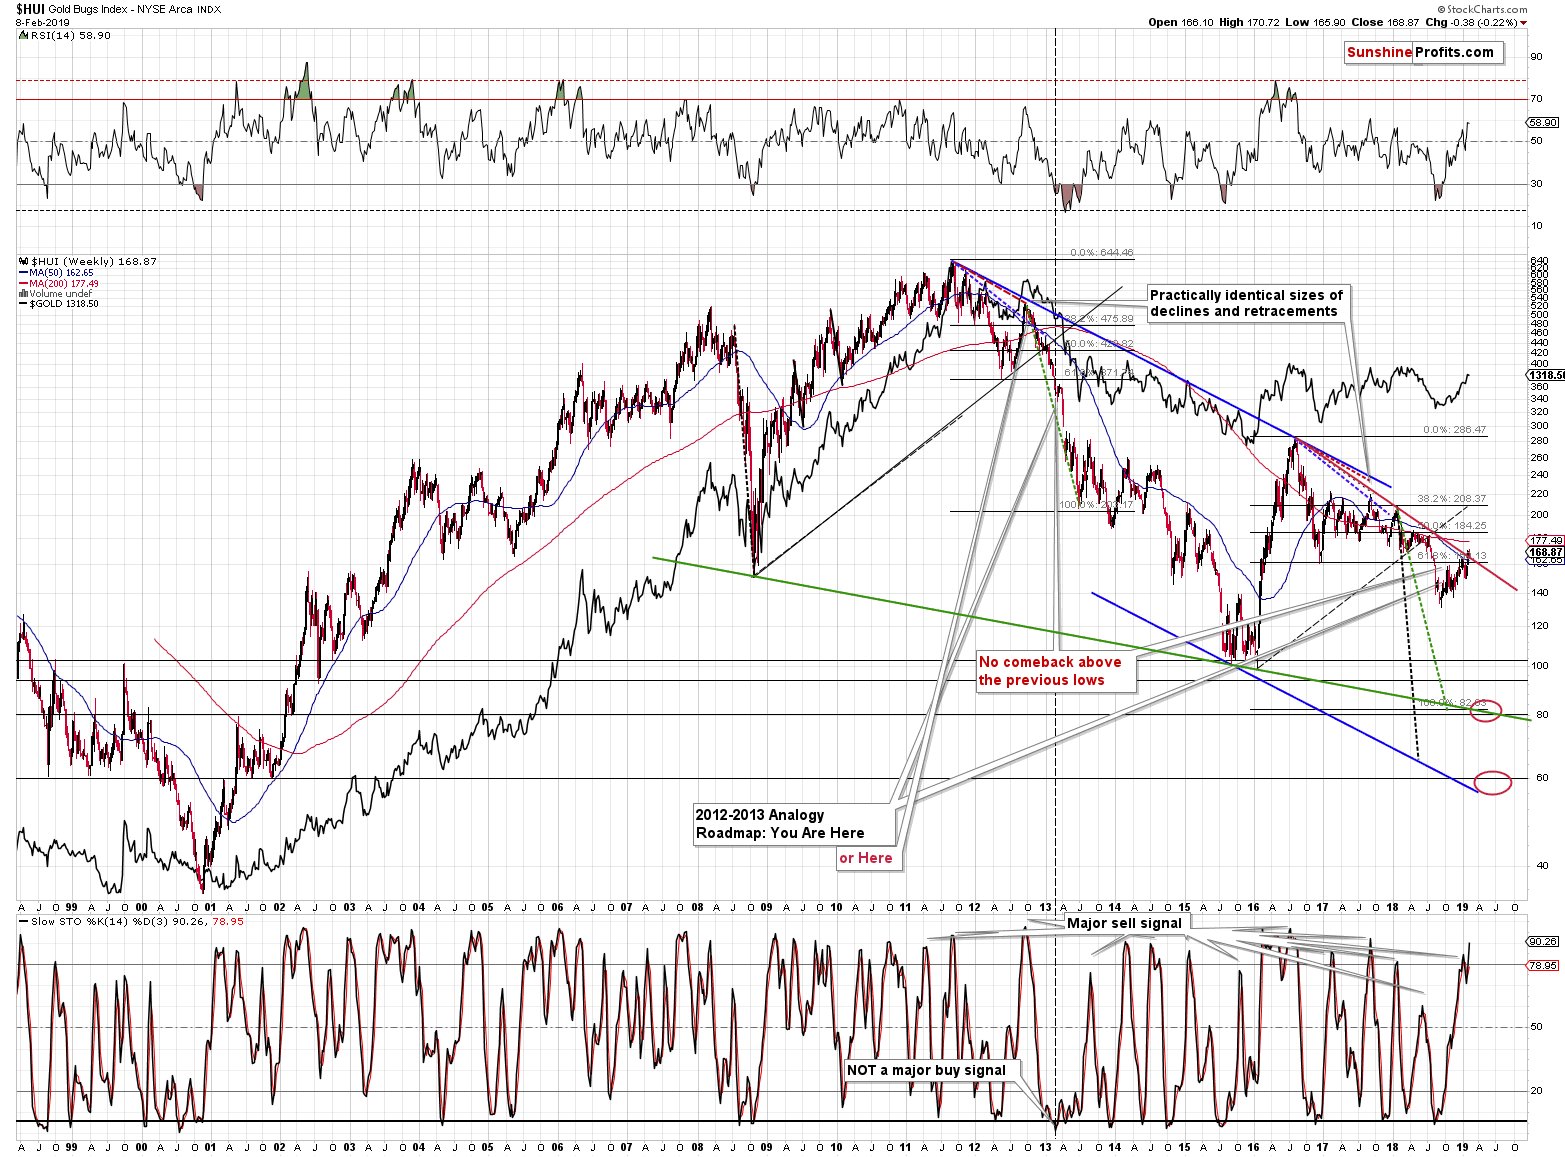
Let's check gold's very long-term picture for more details.
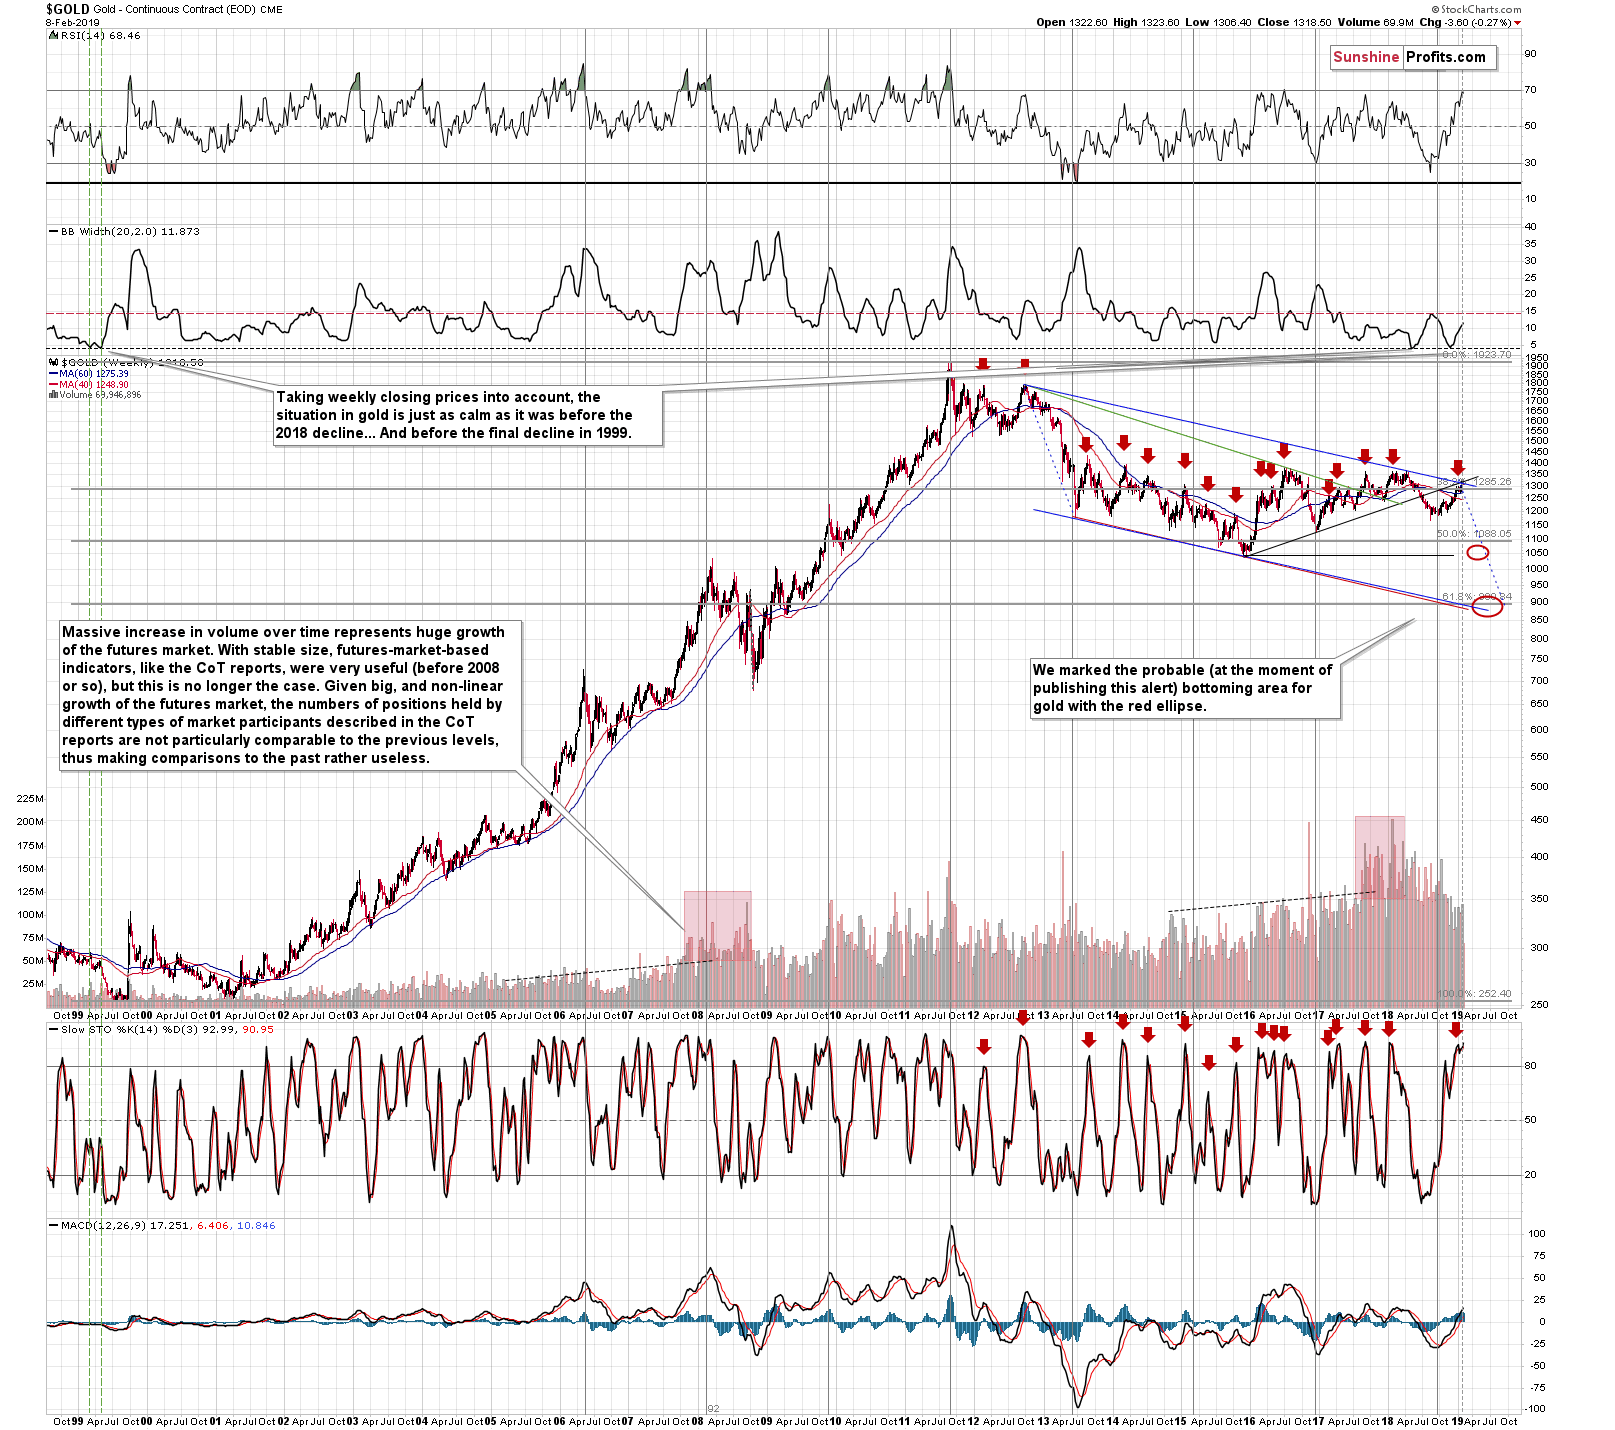
Just like it's visible on the first chart, we see that gold moved to the long-term vertex-based reversal, RSI touched the 70 level thus flashing a reliable sell signal, and the Stochastics is about to flash a sell signal as well. This is already a very powerful bearish combination, even without taking into account that only little more short-term weakness is needed for the latter.
It all happened after gold moved higher for a few months, which took place on a relatively low volume overall. This rally may have appeared significant, but from the long-term point of view, it looks much more like a medium-term correction, similar to the one that took place in late 2012.
Gold and Corporate Bonds Link
We usually write a lot about the gold and USD Index link as it deserves such a close attention. When situation calls for that, we also discuss the gold and shares (SPX) link. Nothing changed with regard to the above links, so we'll focus on other issues today. In particular, we will shine light on another major asset class and examine its relationship to gold. It will be bonds, and corporate bonds are a good proxy to do so. Let's dive in and do so in the context of the gold bear market, right after the 2011 topping action.
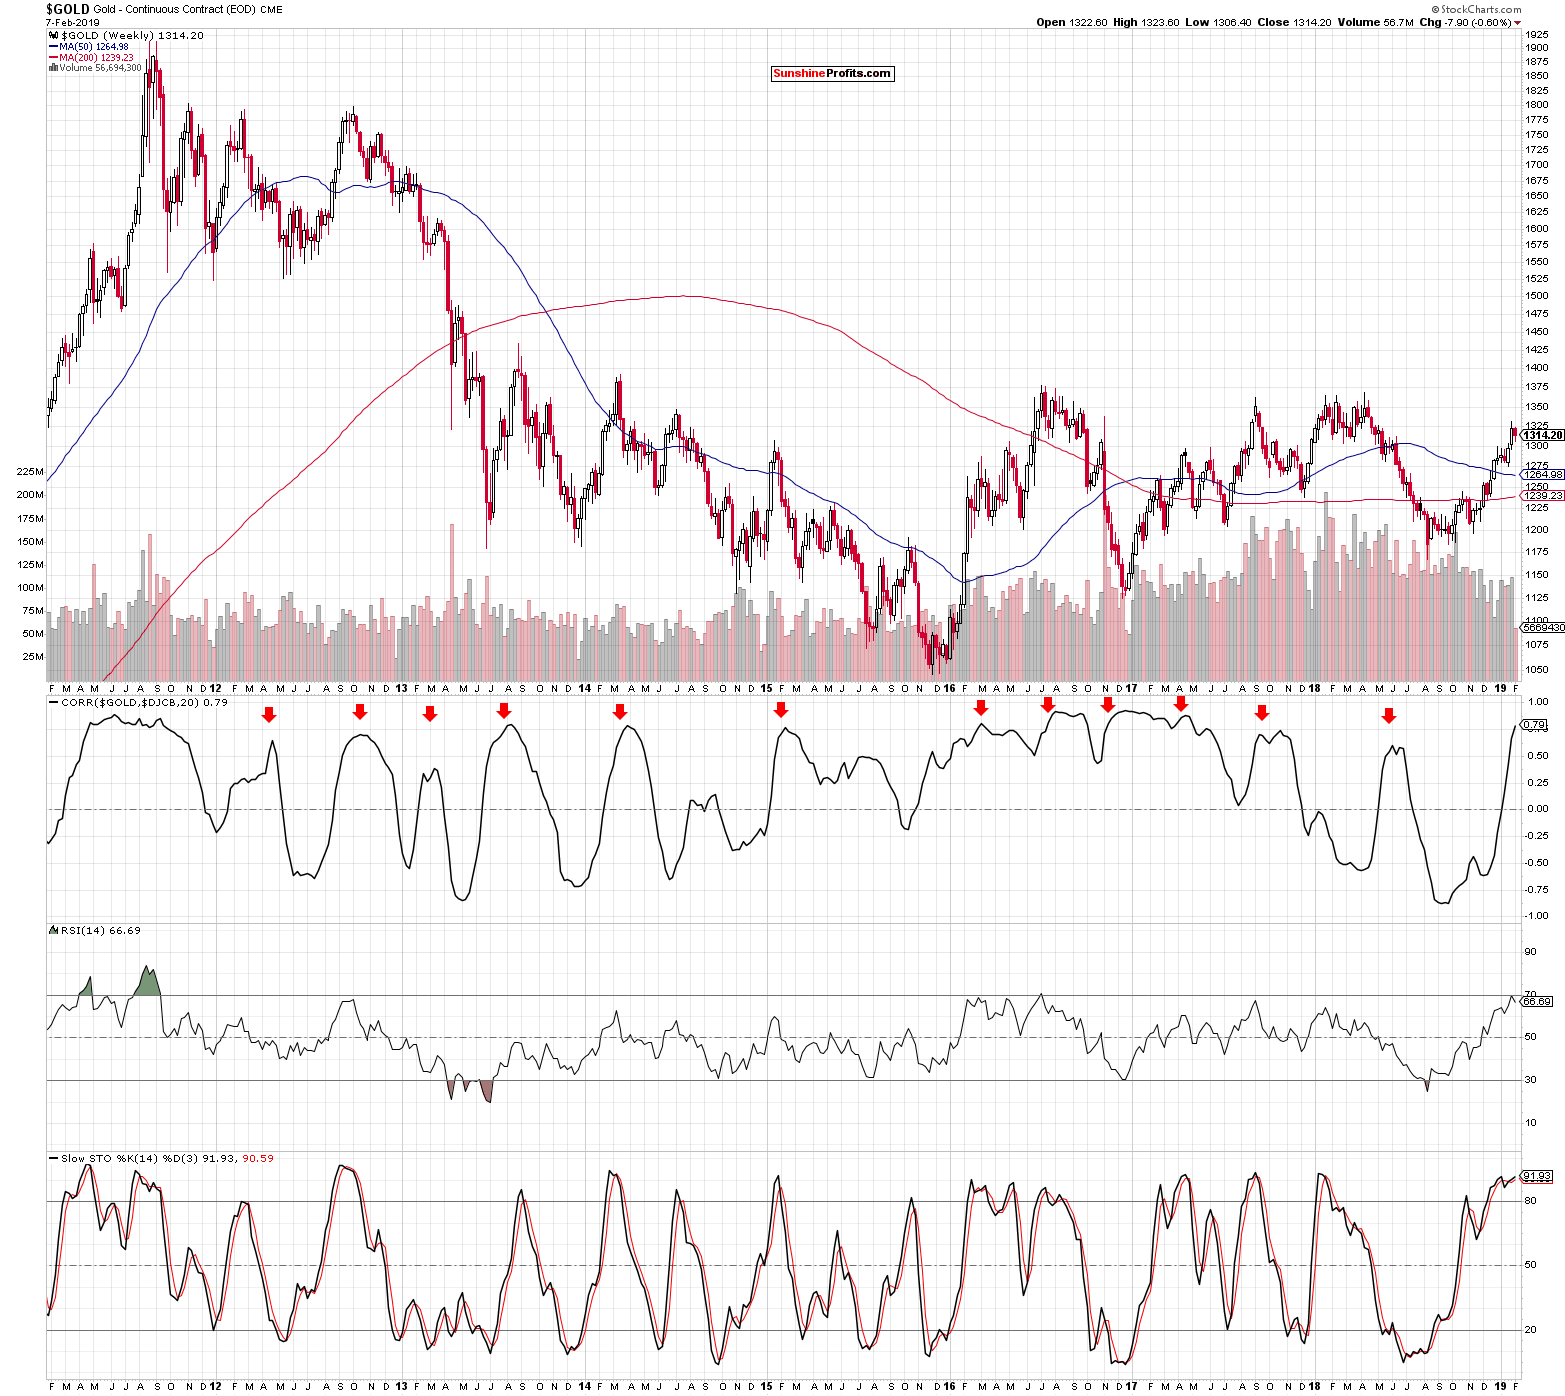
Correlation has been fluctuating between positive and negative values for the period in question. However, there is one thing immediately apparent. The local peaks in positive correlation where the coefficient has reached values generally over 0.50. Overwhelmingly, these marked reliable shorting opportunities as the price of gold declined right there or shortly thereafter. The dozen instances speak clearly. Only the first of them (Q2 2012) was followed by a prolonged sideways consolidation that eventually gave way to a temporary price upswing. This was the period of Quantitative Easing 3 introduction. Similarly, the low unmarked positive correlation peak in summer 2015 was followed by gold price upswing and only then the price crashed below previous lows.
Most importantly, the higher-value peaks indicate interesting shorting opportunities and the current correlation value fits the description.
That's enough about gold for today - let's take a look at gold's sister metal – silver.
The Silver Fakeout
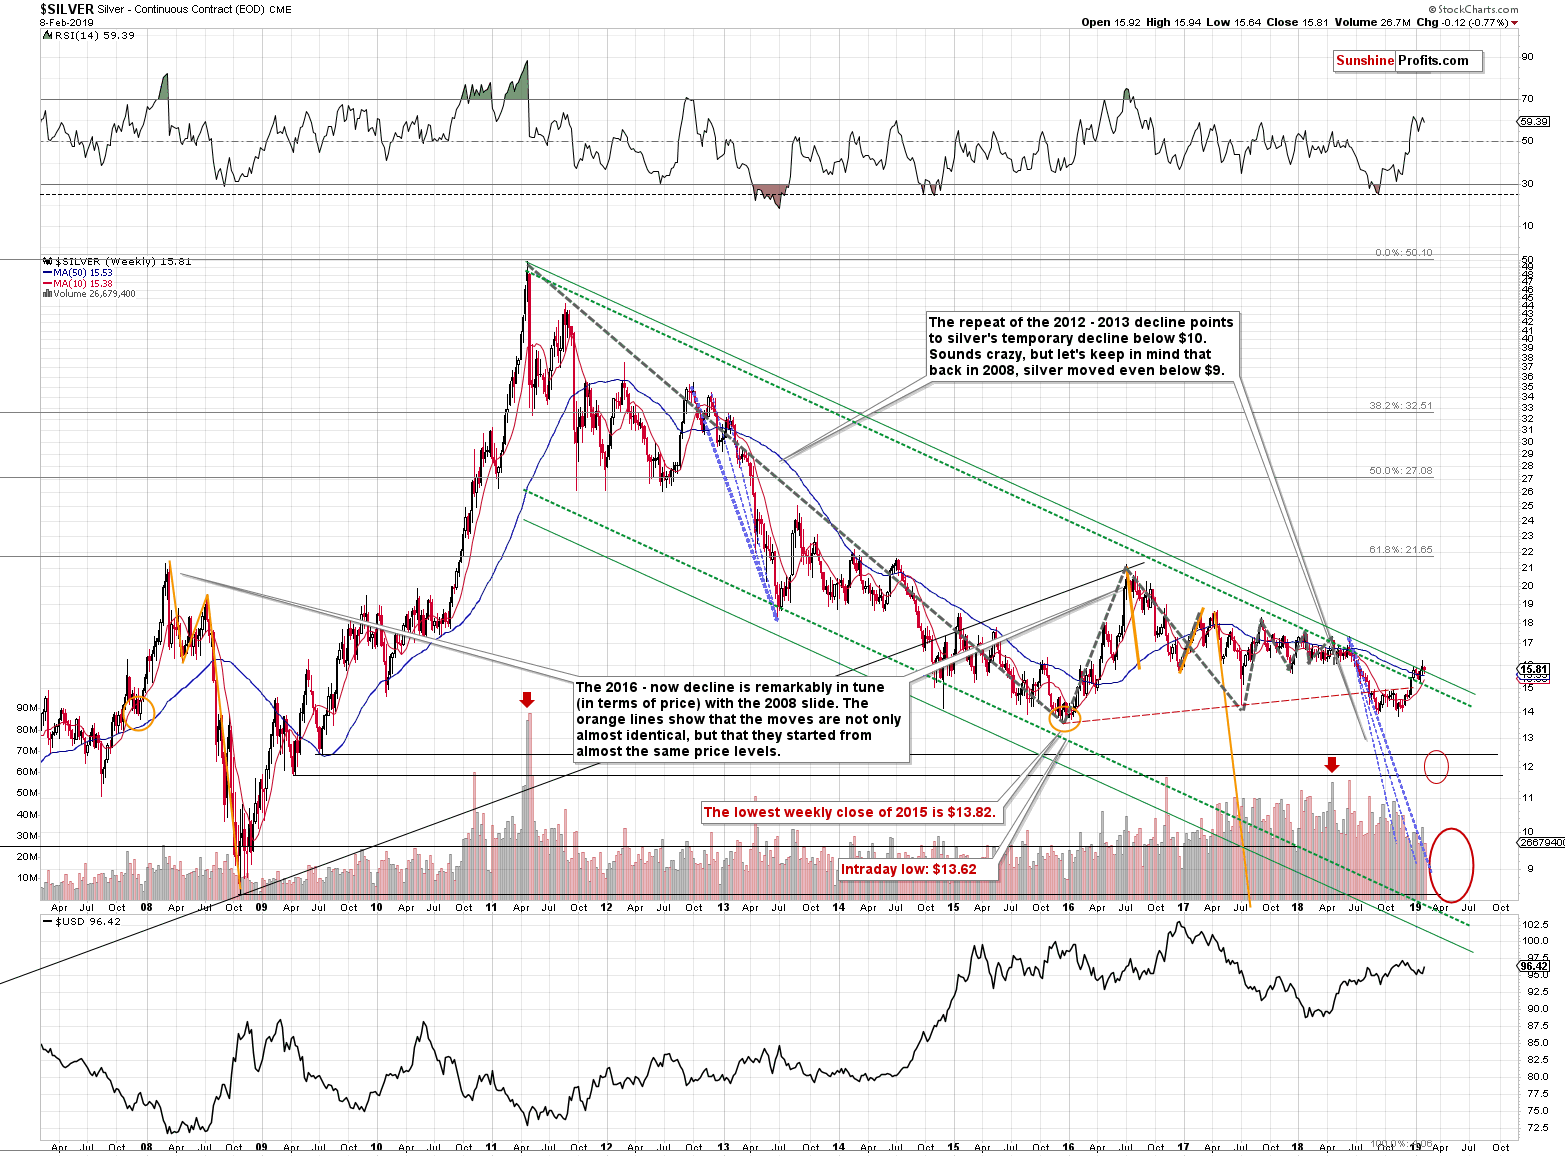
Silver invalidated its small breakout above the long-term resistance line, just like we expected it to. The invalidation took place in intraday terms, and not yet in terms of the weekly closing prices. On Tuesday, we wrote the following:
Silver might move higher, even above this important line. After all, silver is known for forming fakeouts instead of breakouts. But such a move would not likely be significant. Ultimately, this line is critical so any deviation from the regular course of action (strong resistances are not easily broken) should only be temporary and rather small.
In terms of the intraday price moves, silver already invalidated the breakout above it, showing how the above works in practice. We might see another attempt, but it would very likely fail.
We have seen another attempt to move higher, and it has indeed failed in intraday terms. The silver forecast remains bearish.
Gold Miners: Fakeout in the Making
Gold miners closed the week a bit above their declining resistance line, but this move was small, so it would need to be confirmed in order to have bullish implications. Given the clearly bearish situation in gold - in particular given the long-term resistance and the recent daily and weekly sell signals from the RSI, it seems highly unlikely that gold miners would confirm this breakout.
They have very likely showed fake strength, just like in early 2016 they showed fake weakness. In 2016, when the underperformance and breakdown were invalidated, gold stocks were on a verge of a major upswing. Now, they appear to be on a verge of a huge drop.
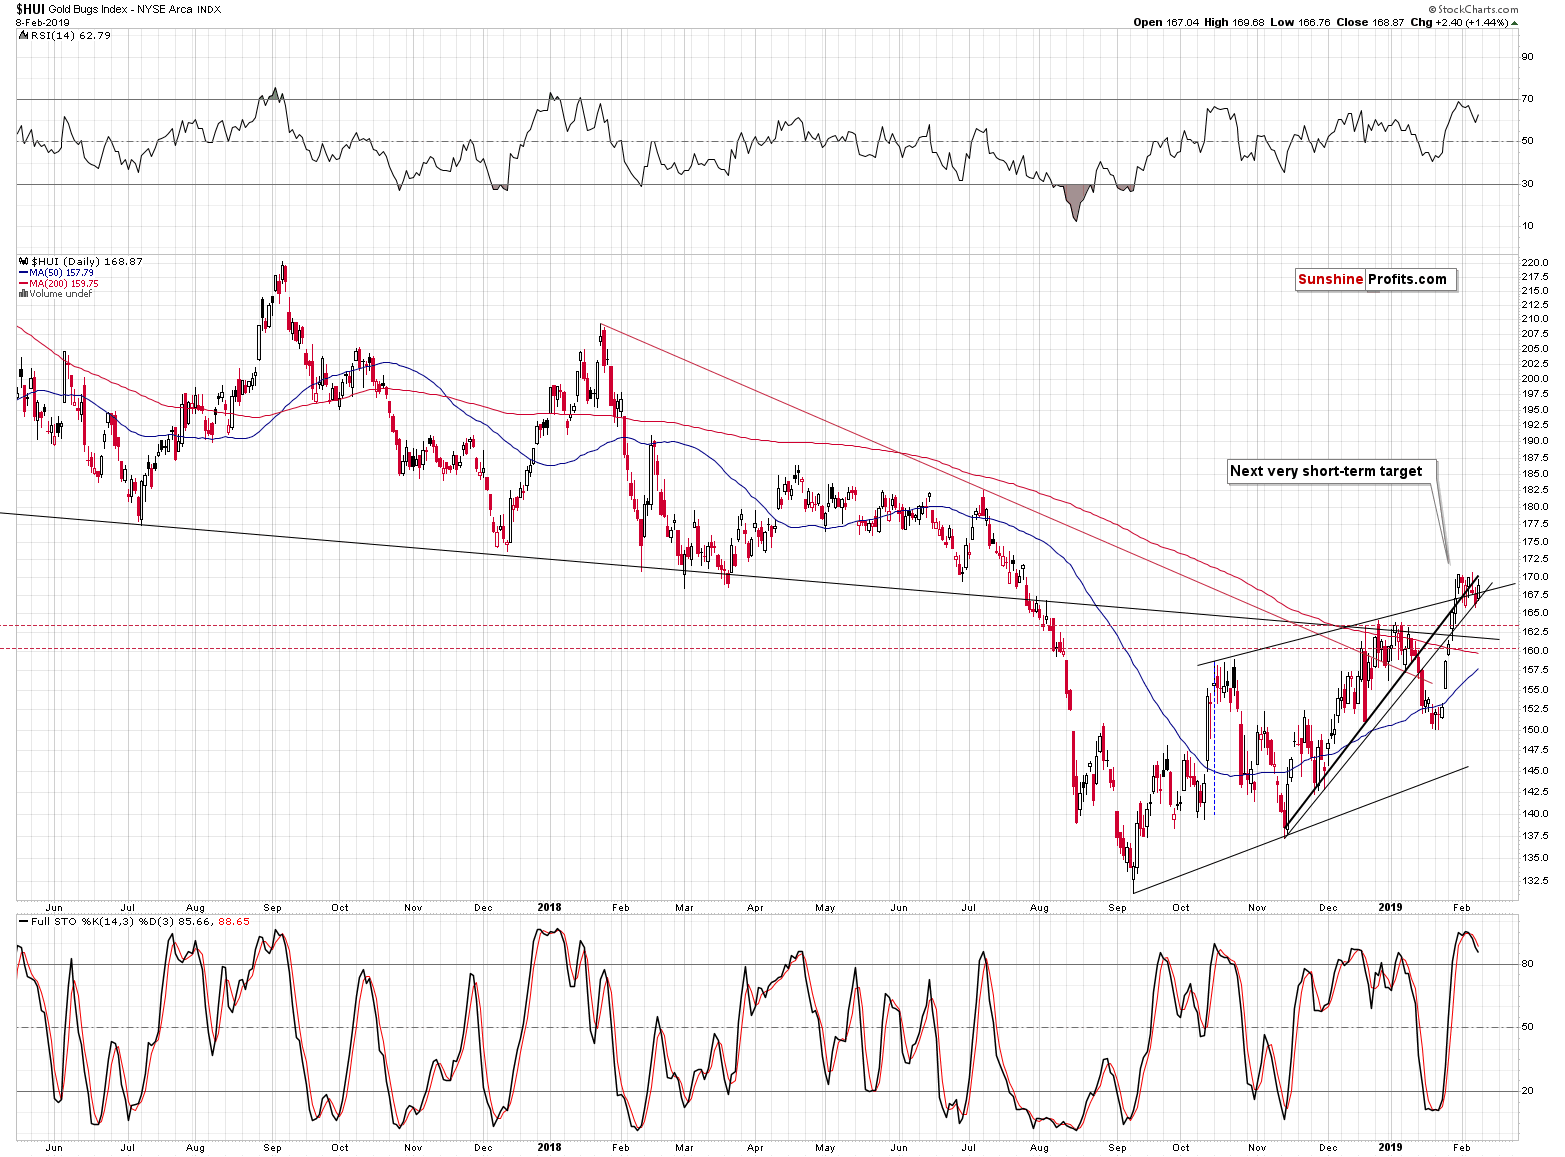
On a short-term basis, please note that the HUI (gold mining stock index) has been moving back and forth after losing its momentum and we recently saw a sell signal from the daily Stochastic indicator. We saw something very similar in mid-October 2018. Back then, a short- term decline followed. This time, based on long-term factors, it seems that we will see something much bigger than just a short-term move.
And now the moment you've probably been waiting for – the palladium volume analysis.
Palladium's Huge Weekly Volume

Just like last week's volume in gold was lowest that we've seen this year, palladium's volume was the biggest. Moreover, it was one of the biggest weekly volume levels that we saw in the last few years. Why would this be a big deal? Because of what happened in the vast majority of previous similar cases.
In 9 out of 11 (almost 82% cases) when palladium rallied for a week on very strong volume, we saw a decline in gold shortly. Why would this be the case? The investment public usually buys what is already high and it tends to buy right before or at the tops. The investment public is also usually wrong. The palladium price has definitely showed strength recently and the high reading in the weekly volume level may illustrate the increased interest of the investment public. The implications are bearish.
Let's stay with the PGM group for a while.
Platinum Revisited
It is time to feature platinum in our analysis again. After all, it is an integral part of the PMs complex and provides valuable clues as to the relative strength of price movements in gold and silver. The same can be said about the relative strength of the gold price leading indicator, the gold-miners-to-gold ratio. Let's take a look at whether platinum price action supports recent upswings, or not.
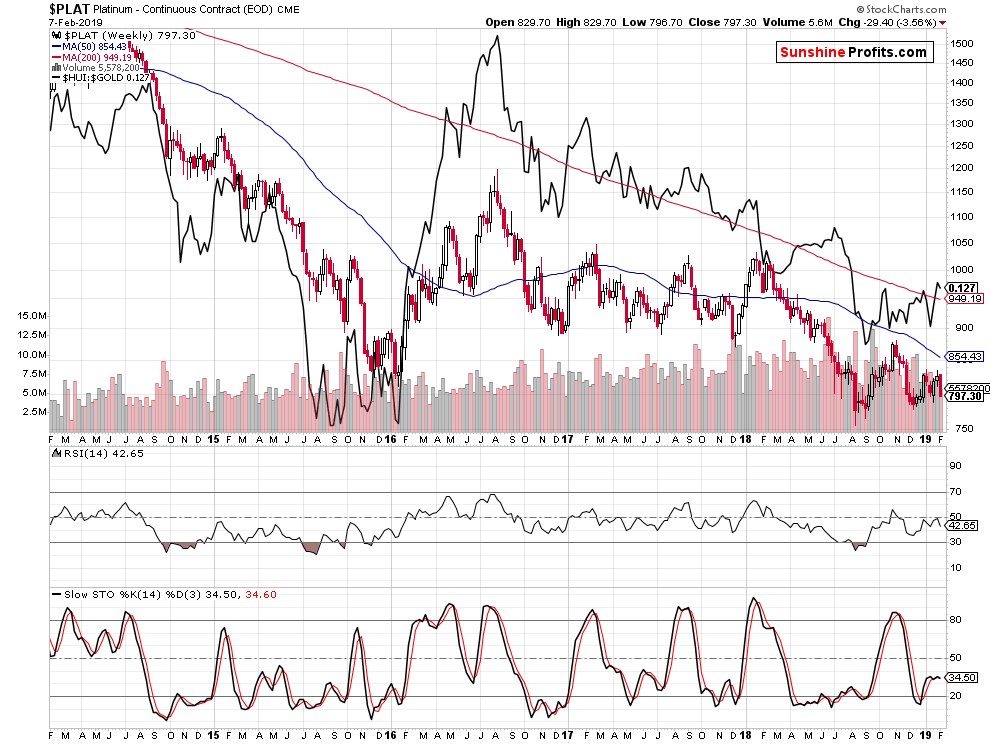
Platinum underperformance is apparent at first sight. It has been duly following the ratio down to the late 2015 local bottom and only feebly recovering while the ratio has made the great upward leap during the early 2016 countertrend rally throughout all the PMs complex. Both these upside moves eventually fizzled out and both platinum and the gold-miners-to- gold ratio embarked on an overall downward trajectory. The sideways consolidation in platinum price in the latter half of 2018 is reminiscent of its 2017 consolidation and is not confirming the ratio upswing since August 2018 (platinum is well below its autumn 2018 highs).
The HUI-gold ratio increase has been unable to solicit a meaningful upswing in platinum price as it did in 2016. This is another reason why the current PMs upswing is so unlike the 2016 countertrend rally with regard to direct implications (both are similar with regard to miners' fake breakout/breakdown, though). The current platinum price consolidation doesn't even provide us with a fakeout local top as in early 2018 – this is yet another indication of internal weakness. The relatively small size of the platinum market compared to gold doesn't justify this underperformance. Just because there is a smaller amount of something available or changing hands in general, doesn't mean that it should decline in value. The implications remain bearish regardless of the above.
Summary
Summing up, the recent rally and kind of resilience in the PMs complex may appear encouraging, but it doesn't change the medium-term trend and outlook, which remains bearish. Since gold, silver, and mining stocks rallied right before the very powerful combination of reversals, it means that the implications for the following weeks are bearish. The signs coming from the volume analysis of both: gold (low), and palladium (high), confirm the above. The small breakout in mining stocks is likely to be invalidated shortly and followed by a sizable downswing.
The upside is quite limited, while the downside remains enormous. The reversals have been reached last week. As PMs, miners, and the USD Index move beyond their reversal dates, the chance for any meaningful upswing in the former before medium-term decline's continuation, is declining with the time passing.
Want free follow-ups to the above article and details not available to 99%+ investors? Sign up to our free newsletter today!
Author

Przemyslaw Radomski, CFA
Gold Price Forecast
Przemyslaw Radomski, CFA (PR) is a precious metals investor and analyst who takes advantage of the emotionality on the markets, and invites you to do the same. His company, Sunshine Profits, publishes analytical software that any


