Gold Price Forecast: XAU/USD looks north amid a potential bull flag and lower yields
- Gold eyes a sustained move above $1800 amid weaker Treasury yields.
- XAU/USD charts a potential bull flag on the hourly sticks.
- All eyes on the US economic data for fresh cues on the dollar and gold.

Gold (XAU/USD) hit fresh three-month highs at $1798 on Monday, kicking off the week on a solid footing. The bulls, however, fell short of the $1800 mark once again, which is now acting as a strong technical hurdle. The yellow metal rallied hard, as the US dollar extended its downside momentum, tracking a fresh sell-off in the Treasury yields. The 10-year US rates briefly dropped below 1.60% amid resurfacing concerns over the economic recovery after the ISM Manufacturing PMI disappointed the optimists, coming in at 60.7 in April vs. 65.0 expectations. Fed’s dovish stance on its monetary policy also keeps weighing negatively on the yields and, in turn, on the dollar.
In Tuesday’s trading so far, gold has eased off the multi-month highs, consolidating the recent upsurge heading into a fresh batch of US economic data. The US ISM-NY Business Conditions Index, Factory Orders and Trade data will offer fresh hints on the economy, which will have a strong bearing on gold prices. In the meantime, Fed Chair Powell’s comments and US dollar bounce keep the metal on the defensive, although weaker yields will likely remain supportive of the recent uptrend.
Gold Price Chart - Technical outlook
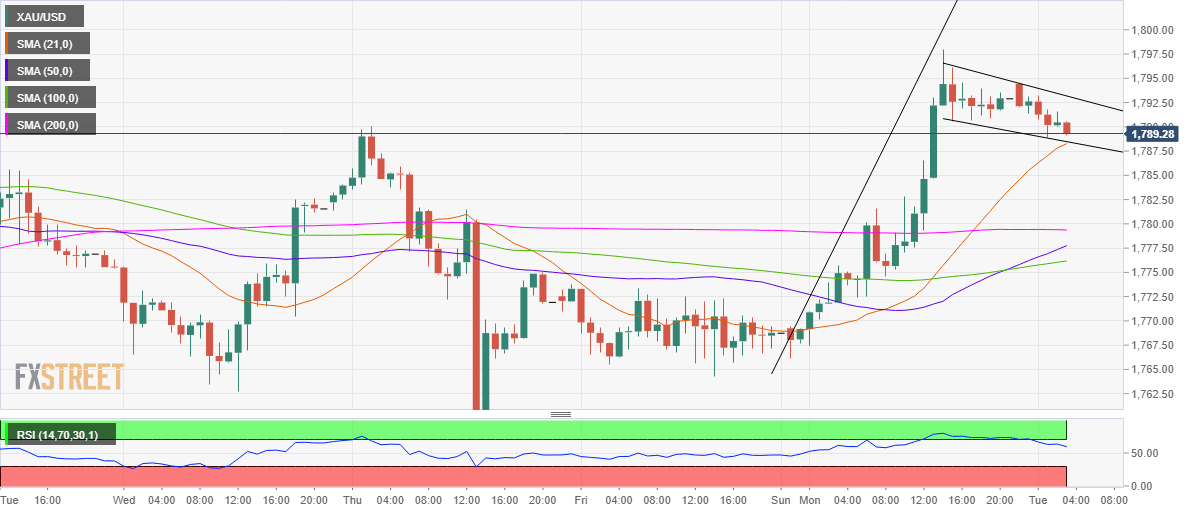
Gold: Hourly chart
Gold has carved out a classic bull flag on the hourly chart after Monday’s rally that followed a brief consolidation in Tuesday’s Asian trading.
An hourly closing above the $1793 barrier is needed to validate the upside break, which would challenge the multi-month highs en-route $1800 and beyond.
The Relative Strength Index (RSI) has turned south but remains well above the midline, keeping the upbeat momentum intact.
To the downside, a strong cushion awaits at $1788, which is the convergence of the bullish 21-hourly moving average (HMA) and the falling trendline support.
A sustained break below which would call in a failure to the bull flag pattern, opening floors for a steep drop towards the horizontal 200-HMA at $1779.
Premium
You have reached your limit of 3 free articles for this month.
Start your subscription and get access to all our original articles.
Author

Dhwani Mehta
FXStreet
Residing in Mumbai (India), Dhwani is a Senior Analyst and Manager of the Asian session at FXStreet. She has over 10 years of experience in analyzing and covering the global financial markets, with specialization in Forex and commodities markets.


