Gold Price Forecast: XAU/USD ends Q1 2024 at record highs, what’s next?
- Gold price hit all-time highs at $2,236 on Thursday to finish Q1 2024 with a bang.
- Gold price ignored a firm US Dollar amid subdued US Treasury bond yields, a robust US economy.
- Gold price looks to $2,251 and US Core PCE inflation on Good Friday.

Gold price is sitting at an all-time high of $2,236, lacking a trading impetus amid holiday-thinned conditions on Good Friday. Most major world markets, including the United States (US) are closed in observance of Holy Friday, leaving volatility around Gold price highly subdued.
All eyes on US Core PCE inflation for next Gold price move
However, traders keenly await the US Personal Consumption Expenditures (PCE) Price Index due later on Friday to gauge the market’s pricing of a potential US Federal Reserve (Fed) interest rate cut in June.
Currently, markets price in about a 64% chance that the Fed will begin cutting rates in June, down from the roughly 70% chance seen at the start of the week. A slew of hawkish commentaries from Fed policymakers and their concerns about sticky inflation have dialed down expectations of rate cuts this year.
The US Dollar extended its last week’s late recovery and is set to finish near six-week highs on Good Friday. Thursday’s upward revision to the fourth-quarter annualized US Gross Domestic Product (GDP) data, from 3.2% to 3.4%, added to the US Dollar strength.
But the US Dollar upsurge failed to deter Gold buyers, as the bright metal clinched fresh record highs. Escalating geopolitical tensions surrounding Russia and Ukraine and the underlying dovish Fed interest rate outlook continue to bode well for the Gold price.
The next move in the Gold price will be determined by the Fed’s preferred inflation measure, the Core PCE Price Index, which will set the tone for markets in the coming weeks. The headline annual PCE Price Index is seen rising 2.5% in February, a tad quicker than a 2.4% increase in January. The Core PCE inflation is likely to hold steady at 2.8% in the reported period, suggesting the stickiness in inflationary pressures.
Gold price ended the first quarter of this year at lifetime highs even though US stock markets marked their strongest Q1 since 1990.
Gold price technical analysis: Daily chart
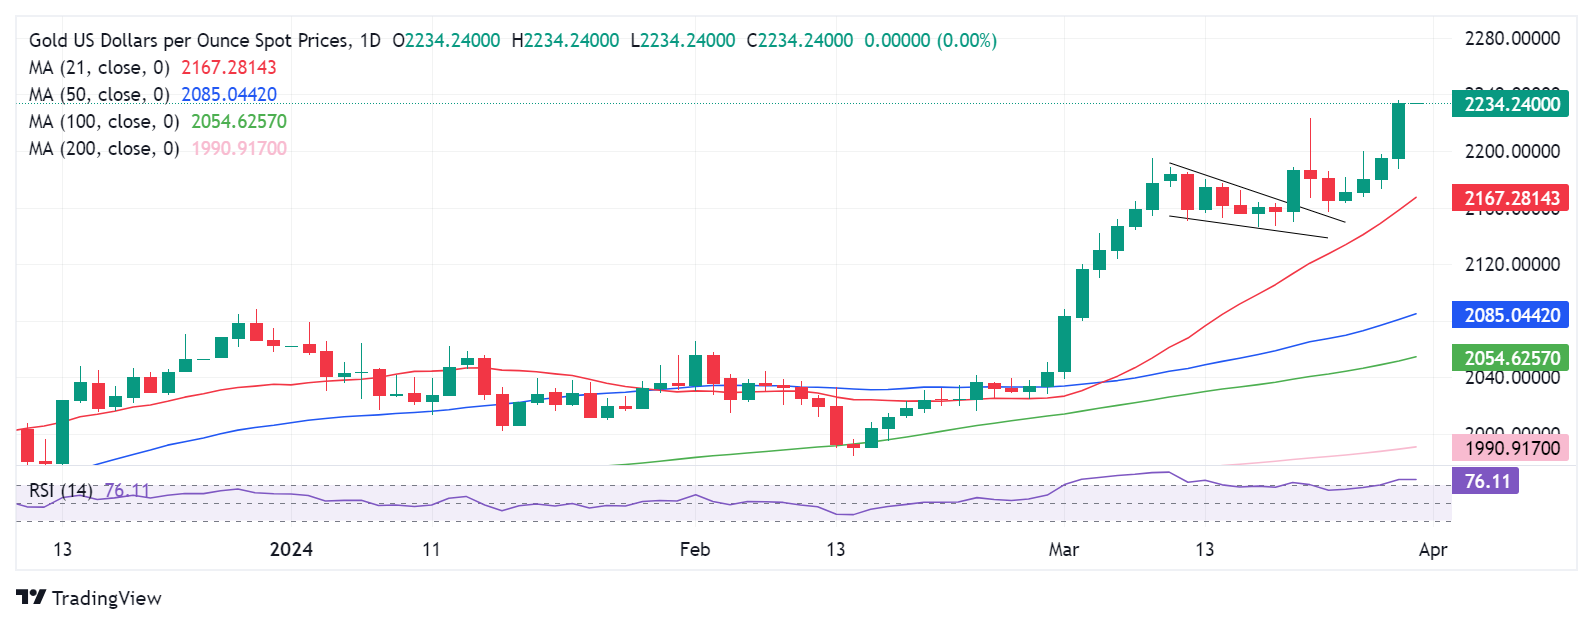
Gold price has still some room for upside, as the Bull Flag target, measured at $2,251, could keep buyers motivated.
Gold traders need to find a sustained footing above the record high of $2,236, at first, to extend the uptrend.
The next on Gold buyers’ radars will be the $2,300 round level.
The 14-day Relative Strength Index (RSI), lies in the overbought zone, suggesting that a pullback could be in the offing before the next rally kicks in.
On the flip side, any retracement will likely find an initial cushion at the previous all-time high of $2,223, below which the $2,200 threshold could be challenged.
Further south, the bullish 21-day Simple Moving Average (SMA) at $2,167 could come to the rescue of buyers.
Gold FAQs
Gold has played a key role in human’s history as it has been widely used as a store of value and medium of exchange. Currently, apart from its shine and usage for jewelry, the precious metal is widely seen as a safe-haven asset, meaning that it is considered a good investment during turbulent times. Gold is also widely seen as a hedge against inflation and against depreciating currencies as it doesn’t rely on any specific issuer or government.
Central banks are the biggest Gold holders. In their aim to support their currencies in turbulent times, central banks tend to diversify their reserves and buy Gold to improve the perceived strength of the economy and the currency. High Gold reserves can be a source of trust for a country’s solvency. Central banks added 1,136 tonnes of Gold worth around $70 billion to their reserves in 2022, according to data from the World Gold Council. This is the highest yearly purchase since records began. Central banks from emerging economies such as China, India and Turkey are quickly increasing their Gold reserves.
Gold has an inverse correlation with the US Dollar and US Treasuries, which are both major reserve and safe-haven assets. When the Dollar depreciates, Gold tends to rise, enabling investors and central banks to diversify their assets in turbulent times. Gold is also inversely correlated with risk assets. A rally in the stock market tends to weaken Gold price, while sell-offs in riskier markets tend to favor the precious metal.
The price can move due to a wide range of factors. Geopolitical instability or fears of a deep recession can quickly make Gold price escalate due to its safe-haven status. As a yield-less asset, Gold tends to rise with lower interest rates, while higher cost of money usually weighs down on the yellow metal. Still, most moves depend on how the US Dollar (USD) behaves as the asset is priced in dollars (XAU/USD). A strong Dollar tends to keep the price of Gold controlled, whereas a weaker Dollar is likely to push Gold prices up.
Premium
You have reached your limit of 3 free articles for this month.
Start your subscription and get access to all our original articles.
Author

Dhwani Mehta
FXStreet
Residing in Mumbai (India), Dhwani is a Senior Analyst and Manager of the Asian session at FXStreet. She has over 10 years of experience in analyzing and covering the global financial markets, with specialization in Forex and commodities markets.


