Gold Price Forecast: XAU/USD bulls up for a last dance ahead of US inflation?


  • Gold price is attempting a bounce towards 21-SMA on 4H.
  • USD bulls take a breather ahead of the all-important US inflation.
  • US stimulus optimism and Delta covid woes lend support to gold price.  

After a tumultuous start to a relatively light week on Monday, gold price licked it wounds and tried to stabilize around $1720-$1730 levels. The yellow metal sustained its recovery from five-month lows of $1688, although finished the day marginally lower amid persistent strength in the US dollar alongside the Treasury yields. The Fed’s tapering expectations remained the main narrative driving the markets, which weighed heavily on the non-yielding gold. However, the mounting fears over the economic impact of the Delta covid variant flareups helped to somewhat lift the pressure off gold price. Meanwhile, gold price also managed to find some support from the US Senate passage of the bipartisan $1 trillion infrastructure bill.

This Wednesday, the key event risk for gold traders remains the US Consumer Price Index (CPI), which is seen arriving a tad weaker at 0.5% in July vs. 0.9% expectations. Meanwhile, the monthly core CPI figure is also likely to drop to 0.4% in the reported month. The softening of price pressures is unlikely to change the recent hawkish Fed expectations, the world’s powerful central continue to dismiss higher inflation as ‘transitory.’ Although, a softer inflation data could fuel a corrective pullback in the dollar, especially after the recent advance, which could further aid gold’s recovery (for now), before the precious metal resumes its downside.

Gold Price Chart - Technical outlook

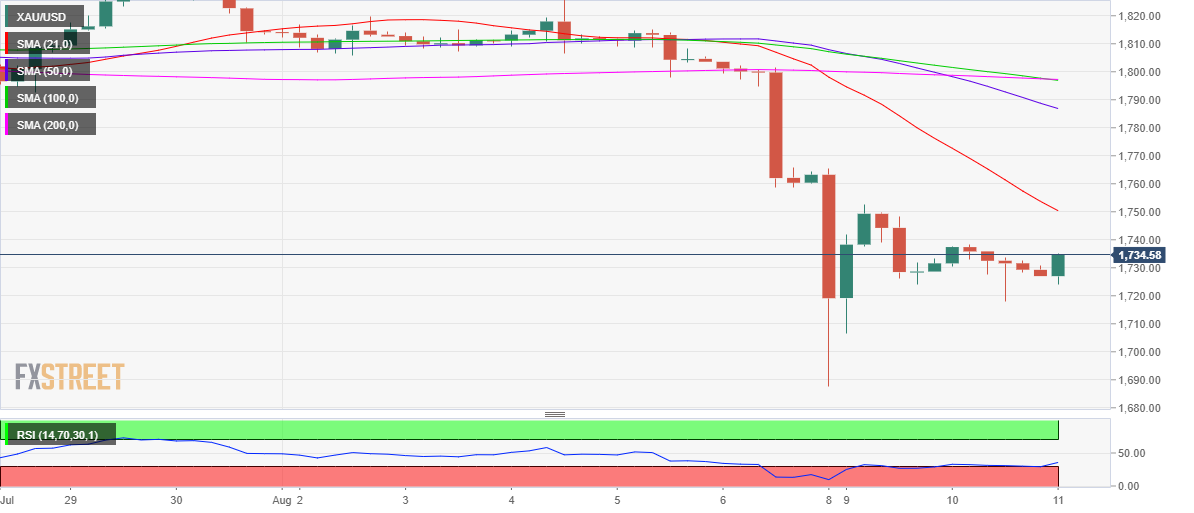
Gold: Four-hour chart

Gold’s four-hour technical chart shows that there is room for recovery, as the Relative Strength Index is witnessing an uptick while it remains below the 50.00 level.

Therefore, gold price looks to recapture the bearish 21-Simple Moving Average (SMA) at $1750.

Although, the further upside appears elusive amid a bearish cross on the said time frame. The 100-DMA has pierced through the 200-DMA from above, flashing bearish signals.

If the bearish pressures return, a test of the $1700 mark will be inevitable. Further south, the multi-month lows of $1688 could be on the sellers’ radars.

Information on these pages contains forward-looking statements that involve risks and uncertainties. Markets and instruments profiled on this page are for informational purposes only and should not in any way come across as a recommendation to buy or sell in these assets. You should do your own thorough research before making any investment decisions. FXStreet does not in any way guarantee that this information is free from mistakes, errors, or material misstatements. It also does not guarantee that this information is of a timely nature. Investing in Open Markets involves a great deal of risk, including the loss of all or a portion of your investment, as well as emotional distress. All risks, losses and costs associated with investing, including total loss of principal, are your responsibility. The views and opinions expressed in this article are those of the authors and do not necessarily reflect the official policy or position of FXStreet nor its advertisers. The author will not be held responsible for information that is found at the end of links posted on this page.

If not otherwise explicitly mentioned in the body of the article, at the time of writing, the author has no position in any stock mentioned in this article and no business relationship with any company mentioned. The author has not received compensation for writing this article, other than from FXStreet.

FXStreet and the author do not provide personalized recommendations. The author makes no representations as to the accuracy, completeness, or suitability of this information. FXStreet and the author will not be liable for any errors, omissions or any losses, injuries or damages arising from this information and its display or use. Errors and omissions excepted.

The author and FXStreet are not registered investment advisors and nothing in this article is intended to be investment advice.

Recommended Content


Recommended Content

Editors’ Picks

EUR/USD clings to gains above 1.0750 after US data

EUR/USD clings to gains above 1.0750 after US data

EUR/USD manages to hold in positive territory above 1.0750 despite retreating from the fresh multi-week high it set above 1.0800 earlier in the day. The US Dollar struggles to find demand following the weaker-than-expected NFP data.

EUR/USD News

GBP/USD declines below 1.2550 following NFP-inspired upsurge

GBP/USD declines below 1.2550 following NFP-inspired upsurge

GBP/USD struggles to preserve its bullish momentum and trades below 1.2550 in the American session. Earlier in the day, the disappointing April jobs report from the US triggered a USD selloff and allowed the pair to reach multi-week highs above 1.2600.

GBP/USD News

Gold struggles to hold above $2,300 despite falling US yields

Gold struggles to hold above $2,300 despite falling US yields

Gold stays on the back foot below $2,300 in the American session on Friday. The benchmark 10-year US Treasury bond yield stays in negative territory below 4.6% after weak US data but the improving risk mood doesn't allow XAU/USD to gain traction.

Gold News

Bitcoin Weekly Forecast: Should you buy BTC here? Premium

Bitcoin Weekly Forecast: Should you buy BTC here?

Bitcoin (BTC) price shows signs of a potential reversal but lacks confirmation, which has divided the investor community into two – those who are buying the dips and those who are expecting a further correction.

Read more

Week ahead – BoE and RBA decisions headline a calm week

Week ahead – BoE and RBA decisions headline a calm week

Bank of England meets on Thursday, unlikely to signal rate cuts. Reserve Bank of Australia could maintain a higher-for-longer stance. Elsewhere, Bank of Japan releases summary of opinions.

Read more

Majors

Cryptocurrencies

Signatures