Gold Price Forecast: XAU/USD bull-bear tug-of-war to extend but upside risks likely
- Gold is on a slippery slope, as the US dollar catches a risk-off bid.
- Pre-Fed anxiety and Omicron risks fuel risk-aversion across the board.
- A symmetrical triangle is on the 4H chart but 100-SMA is the level to beat for gold bulls.

Gold price extended the previous rebound from multi-day lows and tested the critical resistance zone around $1,792 on Monday, kicking off the week on a positive note. The uptick in gold price was underpinned by the risk-off market mood, as the concerns escalated over the Omicron covid variant, in the wake of rising infections in China, Australia, the UK and parts of Europe. Investors feared its impact on the global economic recovery at a time when the major central banks are planning to tighten policies. The Fed is likely to announce faster tapering as soon as Wednesday. Amid a flight to safety, havens such as the US Treasuries, gold, etc benefited at the expense of yields and Wall Street indices.
On Tuesday, gold price has snapped its two-day uptrend, as the safe-haven dollar has found support from the extension of the risk-off trades. Omicron's fears and worries over hastened Fed’s monetary policy normalization is weighing on investors’ mind while they refrain from placing any directional bets on gold price ahead of the all-important Fed decision. The Fed’s dot plot graph will be key to determining the next direction in gold and the US dollar. In the meantime, gold traders will continue to take cues from the Omicron updates, US PPI data and Fed sentiment,
Gold Price Chart - Technical outlook
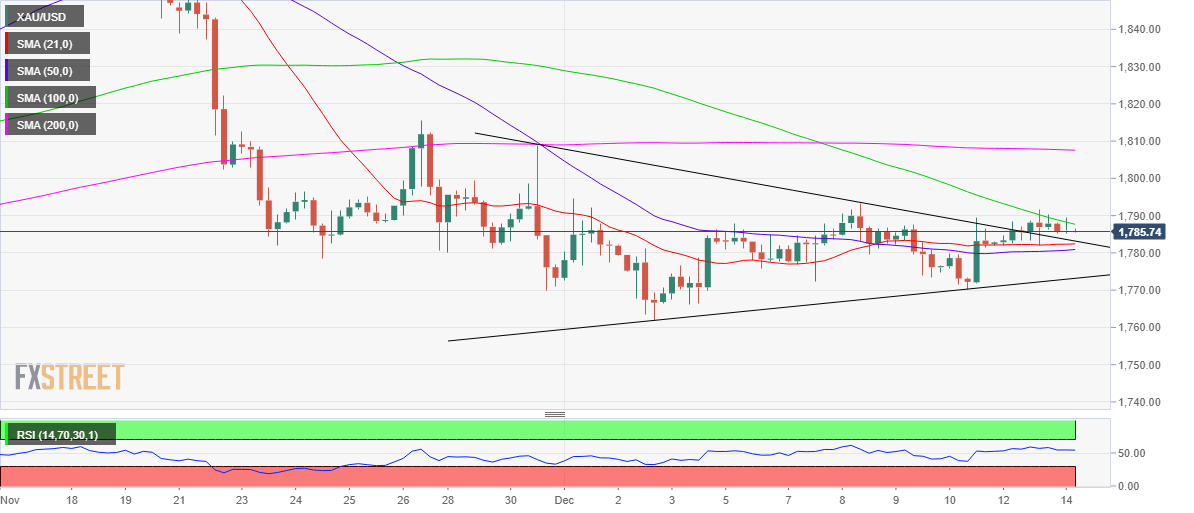
Gold: Four-hour chart
On the four-hour chart, gold’s upside breakout from a two-week-long symmetrical triangle remains capped by the downward-sloping 100-Simple Moving Average (SMA) at $1,788.
Recapturing the latter on a four-hourly candlestick closing basis is needed to extend the break higher.
The Relative Strength Index (RSI) is trading flatlined but keeps its hold above the 50.00 level, suggesting that there is scope for a rebound in gold price.
Acceptance above the 100-SMA will call for a test of the $1,800 mark, above which a rally towards the horizontal 200-SMA at $1,808 is inevitable.
On the flip side, the downside is likely to be protected by the powerful support of around $1,782, which is the confluence of the triangle resistance turned support, 21- and 50-SMAs.
Further south, the triangle support at $1,773 could come to the rescue of gold bulls. The last line of defense for buyers is seen at around $1,761.
Premium
You have reached your limit of 3 free articles for this month.
Start your subscription and get access to all our original articles.
Author

Dhwani Mehta
FXStreet
Residing in Mumbai (India), Dhwani is a Senior Analyst and Manager of the Asian session at FXStreet. She has over 10 years of experience in analyzing and covering the global financial markets, with specialization in Forex and commodities markets.


