Gold Price Forecast: XAU/USD at crossroads, US PCE inflation holds the key
- Gold price remains on the defensive amid the US stimulus-led rally in Treasury yields.
- US dollar benefits from higher yields as the market turns cautious.
- US Core PCE Price Index to determine gold’s next direction.

Gold price (XAU/USD) finished Thursday almost unchanged around $1896, unable to resist above the $1900 mark. Gold price breached the key $1891 support after the 10-year Treasury yields advanced through 1.60% on the New York Times report that US President Joe Biden is pushing for $6 trillion in spending for the 2022 fiscal year. This came a day before the White House’s budget proposal. The greenback also drew support from upbeat US data. However, hopes for the US stimulus drove the Wall Street rally, which kept the dollar’s gains in check, helping gold stage a modest rebound. Gold price also recovered amid increased buying support from China and India. Meanwhile, rising inflation expectations continue to boost gold’s appeal as a hedge against inflation.
This Friday, all eyes remain on the critical US Core Personal Consumption Expenditure (PCE) Price Index release, the Fed’s preferred inflation measure, which excludes volatile items such as energy and food prices. Gold’s fate hinges on the outcome of US PCE data, as a faster-than-expected increase in the price pressures could add fuel to the Fed’s tapering expectations, sending the yields and the dollar northwards and vice-versa. The Fed policymakers have recently revived calls for taper talks, dismissing rising inflation concerns. The US Core PCE is seen higher by 2.9% YoY in April vs. +1.8% booked previously. Meanwhile, Biden’s budget and month-end flows will also have a major influence on gold price.
Gold Price Chart - Technical outlook
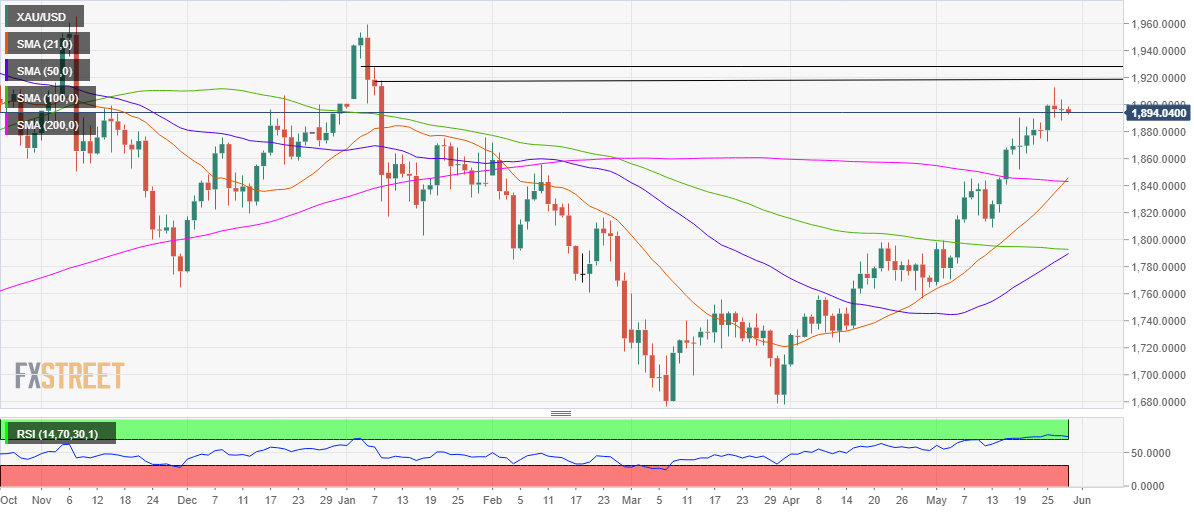
Gold: Daily chart
Upbeat US PCE inflation report is likely to trigger an extension of the correction from multi-month highs, with strong support seen around $1870 levels. A breach of the latter could expose the $1845 cushion, the confluence of the 21 and 200-daily moving averages (DMA).
The Relative Strength Index (RSI) remains within the overbought territory, keeping gold price at an imminent risk of decline, which could likely get compounded due to the effect of strong inflation figures.
However, the losses may remain capped by a bull cross confirmed on the daily chart after the 21-DMA pierced through the 200-DMA from below.
If the data fall short of expectations, the price could rebound towards May 26 highs of $1913, above which the January high of $1918 could get tested. The next upside target is seen at $1930, the round number.
Author

Dhwani Mehta
FXStreet
Residing in Mumbai (India), Dhwani is a Senior Analyst and Manager of the Asian session at FXStreet. She has over 10 years of experience in analyzing and covering the global financial markets, with specialization in Forex and commodities markets.


