Gold-GameStop (GME Stock) connection? It's an emotions game

There are many factors affecting gold prices on a daily basis, but… how can GameStop stock be one of them?
Given today’s pre-market slide in gold, it seems that the triangle-vertex-based turning point worked once again. Declines are likely next.
In yesterday’s analysis, I explained why the situation remains very similar to what happened in 2013, and that remains up-to-date. On top of that, two interesting things happened yesterday: one quite obvious and one less obvious.
White metal outperformance
The more obvious one was that silver outperformed gold on a short-term basis.
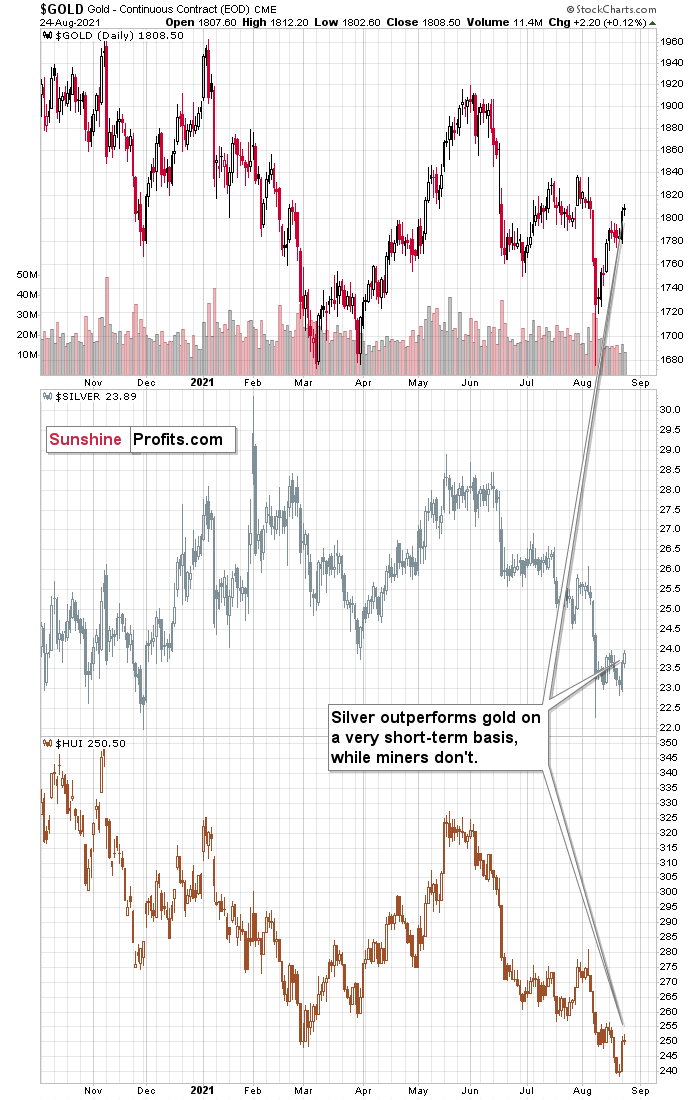
While miners and gold were almost flat yesterday, silver’s daily upswing was notable. Nothing to write home about, but it was visibly bigger than what we saw in gold and miners. These moments – when silver outperforms on a very short-term basis – tend to take place right before the prices of the precious metals and mining stocks decline.
Remember the early-August breakout in silver that turned out to be a fakeout? Silver broke above new highs while gold didn’t, so it outperformed on a very short-term basis. And just as lower prices followed then, lower prices are likely to follow soon (not necessarily immediately, though).
Have you heard about GameStop?
The less obvious indication of a turnaround in gold came from the… GameStop stock price.
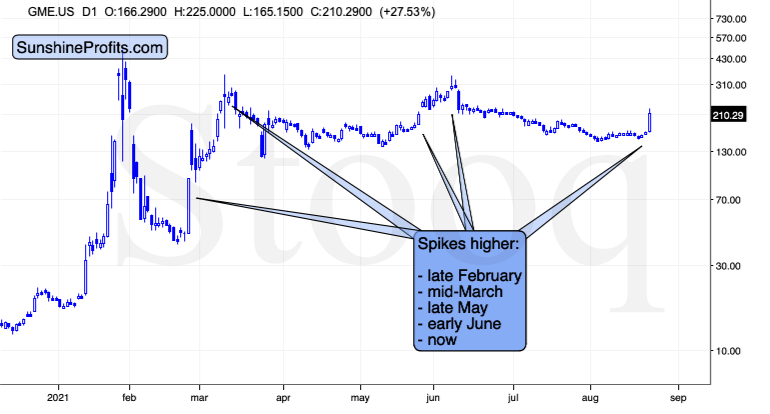
Yesterday’s sizable price spike is something that we saw several times this year. I’m not taking into account the January rally, as it was a specific forum-activity-based upswing that seems to be of one-of-a-kind nature. Except for yesterday’s price spike, there were also four other similar spikes. Let’s check if there was any kind of regularity on the gold market at the same time.
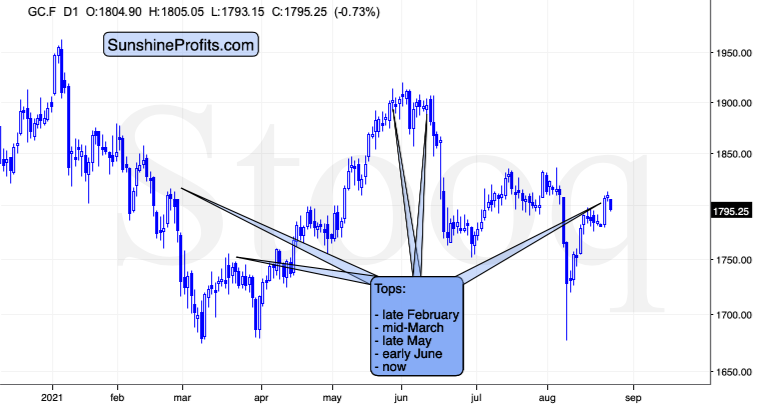
It turns out that in all four cases when the GameStop stock price spiked, gold was topping. Does it make any sense, and can one, therefore, count on this being repeated?
Actually, it does make sense. The assets are not really directly related, but they are related in terms of people’s emotions. The GameStop trade was quite an emotional one, people were jumping on board based on fear of missing out regardless of anything else. And nothing really changed since that time. The current valuations of the stock seem to be based on the same emotional aspect along with people’s ability to finance the purchases, perhaps based on leveraged stimulus-based funds. Consequently, the price spikes in GameStop might be a barometer for a specific type of emotionally driven purchases. And if the market is emotional in one specific way, it could impact more (all?) assets in one way or another. In the case of gold, it seems that when emotions (as indicated by GameStop stock) spiked, gold was topping.
Actually, it could be the case that the reason why silver outperforms gold on a short-term basis is related to the above. Silver is a smaller market, and it’s much more popular among individual investors than among institutions. No wonder that emotions play a part here, as the former are generally more emotional than the latter.
Having said that, let’s take a look at gold.
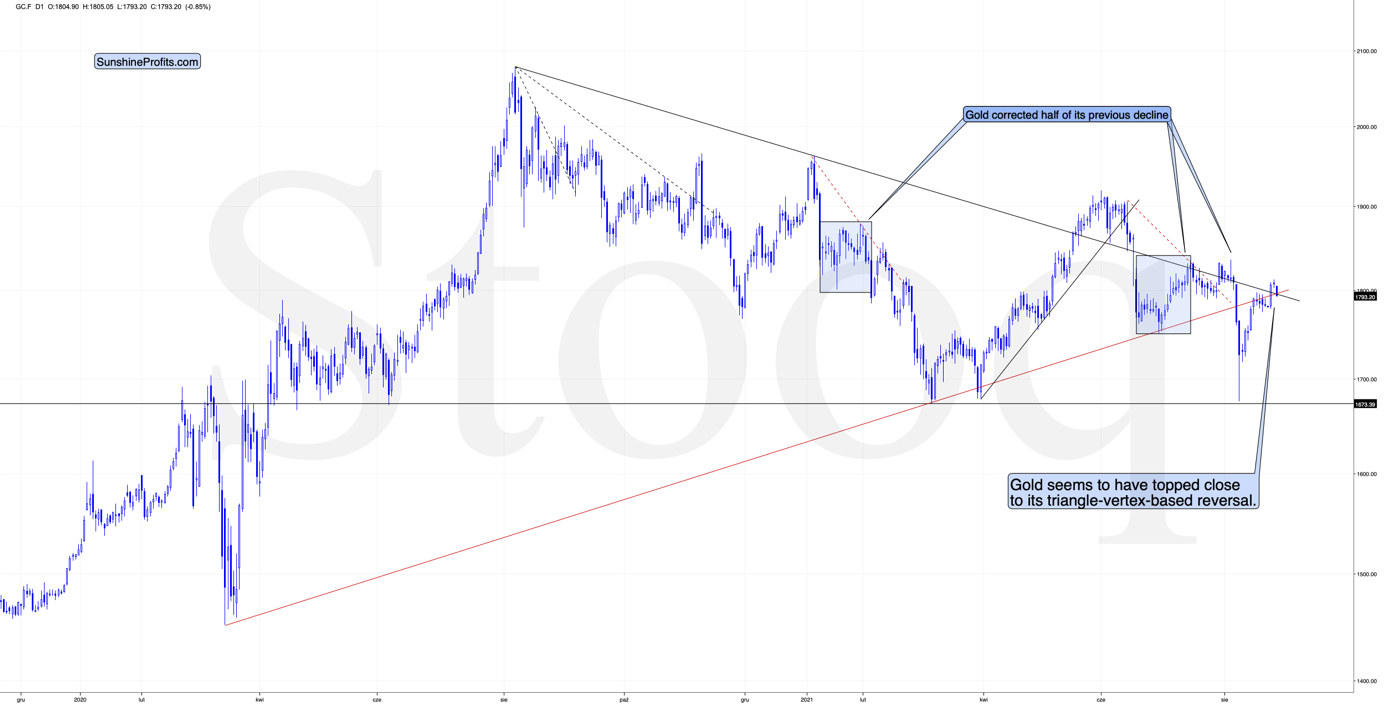
The yellow metal moved lower today, close to its triangle-vertex-based reversal. Consequently, the top might be in based on just that indication, and there are plenty more coming from other markets.
The USD Index, for example.
The dollar’s behavior
Yesterday, I commented on the above chart in the following way:
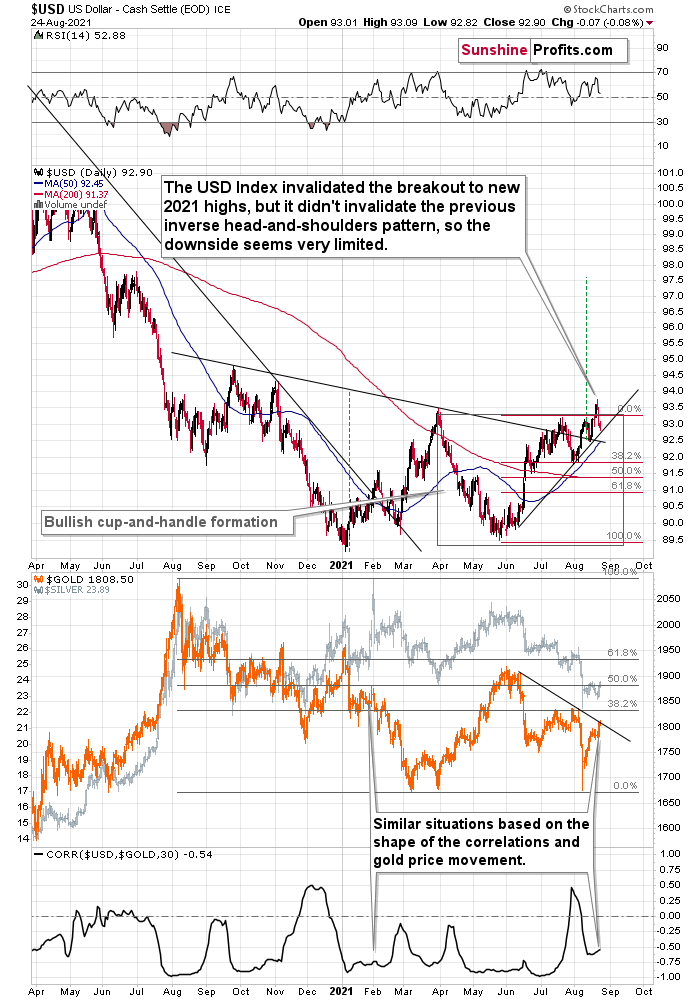
The USD Index invalidated the breakout to new 2021 highs, but it didn't invalidate the previous inverse head-and-shoulders pattern, so the downside seems very limited.
There’s a rising short-term support line based on the June and July lows that currently “says” that the USD Index is unlikely to fall below ~92.75. At the moment of writing these words, the USD Index is trading at about 93.07, so it’s very close to above-mentioned level.
And even if the USDX declines below it, there’s support at about 92.5 provided by the neck level of the previously confirmed inverse head-and-shoulders pattern. This means that the USDX is unlikely to decline below this level, and this in turn means that the downside seems to be limited to about 0.6 index point. That’s not a lot.
Remember when the USD Index previously invalidated the breakout above the inverse H&S pattern? I wrote then that it could decline to the nearest support level provided – then – by the 38.2% Fibonacci retracement. Now the nearest support is provided by the rising support line at about 92.75.
This doesn’t mean that gold will necessarily rally from here or that the rally will be substantial. On the lower part of the above chart, you can see that gold moved to its declining resistance line, which means that it could decline right away.
The USD Index didn’t move to the above-mentioned rising support line, but it was very close to it. The USD Index has been relatively flat so far today, but gold is already down, so it seems that even if the USD Index bottoms slightly lower, it might not take gold to new short-term highs.
All in all, it seems that the precious metals sector is ready for another sizable decline.
Want free follow-ups to the above article and details not available to 99%+ investors? Sign up to our free newsletter today!
Want free follow-ups to the above article and details not available to 99%+ investors? Sign up to our free newsletter today!
Author

Przemyslaw Radomski, CFA
Gold Price Forecast
Przemyslaw Radomski, CFA (PR) is a precious metals investor and analyst who takes advantage of the emotionality on the markets, and invites you to do the same. His company, Sunshine Profits, publishes analytical software that any


