Gold 2022 Outlook: Correlation with US T-bond yields to drive yellow metal
-
Gold has been showing an inverse correlation with 10-year US Treasury bond yields.
-
Fed’s policy outlook in the face of inflation and COVID will be the main market driver of 2022.
-
XAU/USD needs to break out of the $1,700-$1,900 range to determine its next direction.

Gold spent the first quarter of the year in a consolidation phase after registering impressive gains in 2020. Following a drop below $1,700 in March, XAU/USD reversed its direction and advanced beyond $1,900 but struggled to preserve its bullish momentum. For the remainder of 2021, the yellow metal fluctuated between $1,700 and $1,900.
In early 2021, vaccination efforts alongside the unprecedented monetary and fiscal support measures revived hopes for a robust economic recovery. The reflation trade started to dominate the financial markets and traditional safe-haven assets, such as gold, struggled to find demand while Wall Street’s main indexes rallied to new all-time highs. In the meantime, the benchmark 10-year US Treasury bond yield climbed above 1.7% from 0.9% at the beginning of the year but the Fed’s loose policy made it difficult for the dollar to outperform its rivals.
Several unforeseen developments caused market dynamics to shift in the second half of the year.
The coronavirus Delta variant started to spread rapidly during the summer months and investors were reminded of the fragility of consumer activity and sentiment. In the meantime, the strong demand for goods amid the economic reopening met pandemic-related supply disruptions and significant bottlenecks formed in global supply chains. With producers starting to pass on the increasing input prices to customers, the inflationary effect of bottlenecks on consumers became apparent. In April, the Consumer Price Index (CPI) in the US surged to its strongest level in nearly ten years at 4.2% on a yearly basis before reaching a 39-year high of 6.8% in November.
Initially, the US Federal Reserve downplayed inflation concerns, arguing that price pressures were transitory and that they would dissipate with supply bottlenecks getting resolved in early 2022. However, it didn’t take long for the Fed to acknowledge that high inflation was likely to persist for longer than estimated.
Although gold managed to attract demand as a traditional inflation hedge, rising US Treasury bond yields limited XAU/USD’s upside. Investors started to price a sooner-than-expected policy tightening following the Fed’s decision to reduce asset purchases by $15 billion per month from November and the dollar capitalized on rising yields.
In late November, the detection of a highly-mutated coronavirus variant in South Africa triggered an intense flight to safety and helped the precious metal stay resilient against the greenback.
Gold correlation with 10-year US T-bond yields
Market drives have been causing XAU/USD and the 10-year US Treasury bond yield to move in opposite directions. The inverse correlation was relatively weak at the beginning of the year when reflation trade was dominating markets but it became stronger with investors shifting their focus to inflation expectations. The “transitory inflation” narrative caused the correlation to turn less significant during the summer months before markets realized that the Fed would start tapering QE and consider a rate hike sooner than anticipated.
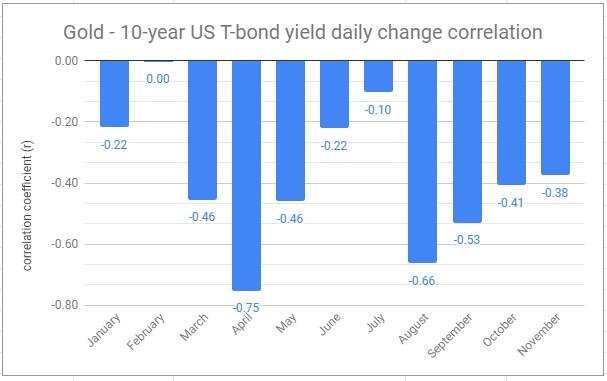
We have taken the daily percentage change of XAU/USD and the 10-year US T-bond yield since the beginning of the year and calculated the correlation coefficient (r) for each month. As the r approaches -1, it shows that the inverse correlation is getting stronger, while a reading close to 0 suggests that those two assets are virtually moving independently from each other. Here are the results:
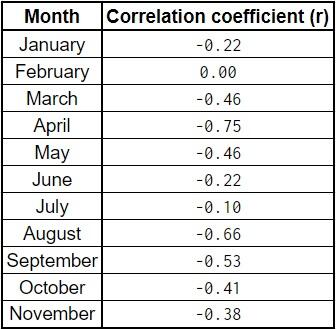
For the whole year, r was -0.33. The correlation was very weak in January and it was non-existent in February. r started to move lower toward -1 in March, showing that the correlation started to strengthen, and it reached its lowest level of the year at -0.75 in April. At the beginning of the third quarter, the correlation turned less significant once again but r edged lower in August before rising above -0.5% in the last quarter.
Gold 2022 outlook
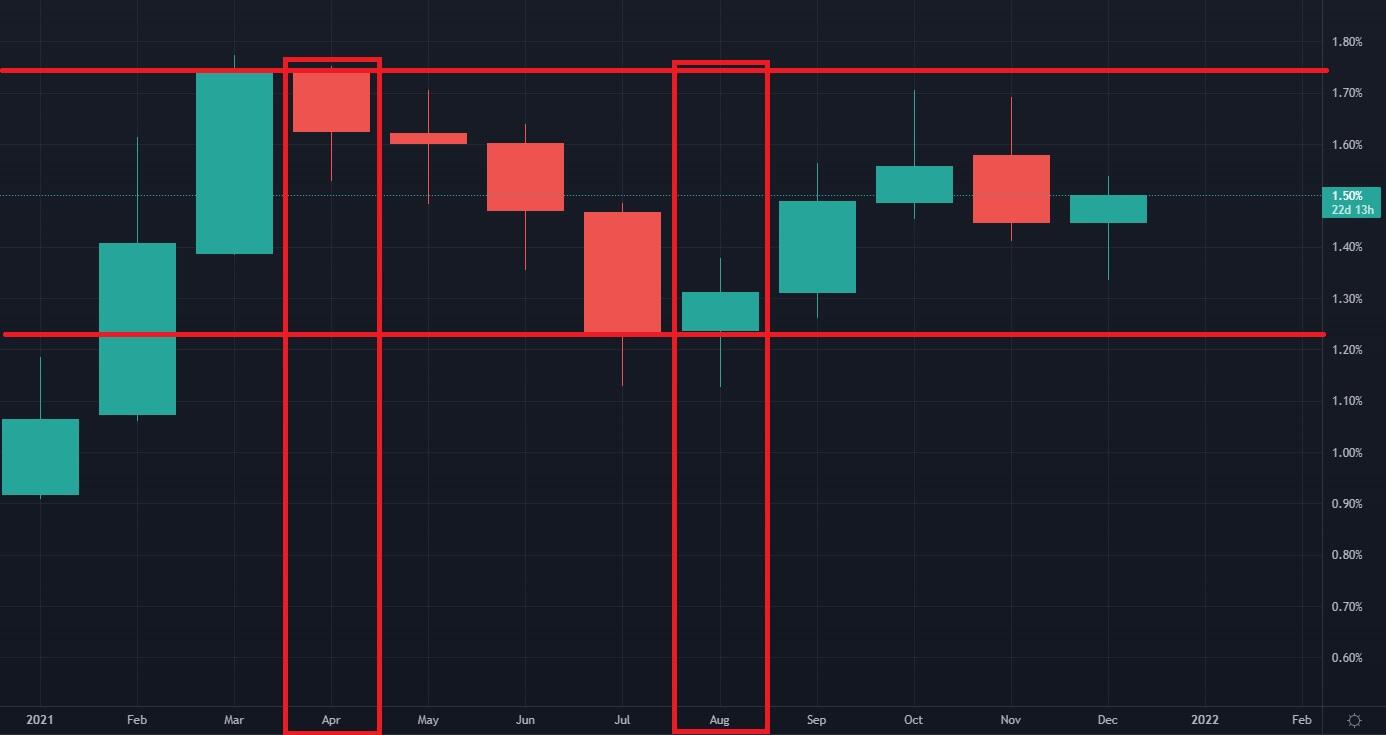
Gold could be expected to continue to stay inversely correlated with the US Treasury bond yields in 2022. It is clear that the correlation becomes very significant during certain periods. These are when there is a correction after the 10-year yield sets a near-term top or bottom. In that sense, 1.75% and 1.2% is an important range for the 10-year yield. In case the yield goes up to 1.75% and fails to break above that level, gold has a tendency to capitalize on the following correction. On the other hand, gold has a propensity to face strong bearish pressure if the 10-year yield turns north after declining toward 1.2%.
The Fed’s policy outlook will be the key factor determining yields’ direction. Currently, the CME Group’s FedWatch Tool shows that markets are pricing an only 20% chance of the Fed leaving its policy rate unchanged by June 2022 and the 10-year yield fluctuates around 1.5%.
Following its December policy meeting, the Fed has announced that it has decided to double the pace of reductions in asset purchases to $30 billion per month from mid-January. At this stage, the QE program will come to an end in mid-March. There won’t be a policy meeting in April and policymakers could opt to wait until June before taking action, and markets are already pricing a rate hike by then.
Meanwhile, the Fed’s latest Summary of Projections, published on December 15, showed that policymakers' median forecast points to three rate hikes in 2022. During the press conference, FOMC Chairman Jerome Powell adopted a cautious tone and noted that it would not be appropriate to hike the policy rate before the taper is completed. Despite the hawkish dot-plot, the market pricing of a March rate hike remained unchanged at around 40% and the 10-year US T-bond yield failed to climb above 1.5%.
If the Fed stays in wait-and-see mode in the first half of 2022 and hikes the policy rate by 25 basis points as expected in June, the timing of the second rate hike will be critical for markets. Markets could start pricing one more 25 basis points hike before the end of 2022 and fuel a rally in yields. That would provide a boost to the dollar and weigh on XAU/USD. In that case, gold buyers could look for the 10-year yield to fail to break above 1.75%.
To summarize, gold’s inverse correlation with the 10-year yield is likely to remain intact in 2022. As yields rise, XAU/USD could be expected to push lower and vice versa. The reversal of gold’s trend could occur if the 1.2% support and the 1.75% resistance for the 10-year yield hold. With a drop below 1.2%, gold could rise above $1,900. On the other hand, the yellow metal could break below $1,700 if the Fed turns even more hawkish next year and lift the yield above 1.75%.
Other than the Fed’s policy outlook, the risk perception could also have a noticeable impact on yields and influence gold’s valuation. A new coronavirus variant with a high mortality rate could trigger a continuous flight to safety in 2022 and that would ramp up the demand for risk-free Treasury bonds and drag the yields lower while lifting gold. Even if that scenario were to materialize, the dollar is likely to outperform its risk-sensitive rivals as well and limit XAU/USD’s downside.
Gold technical analysis
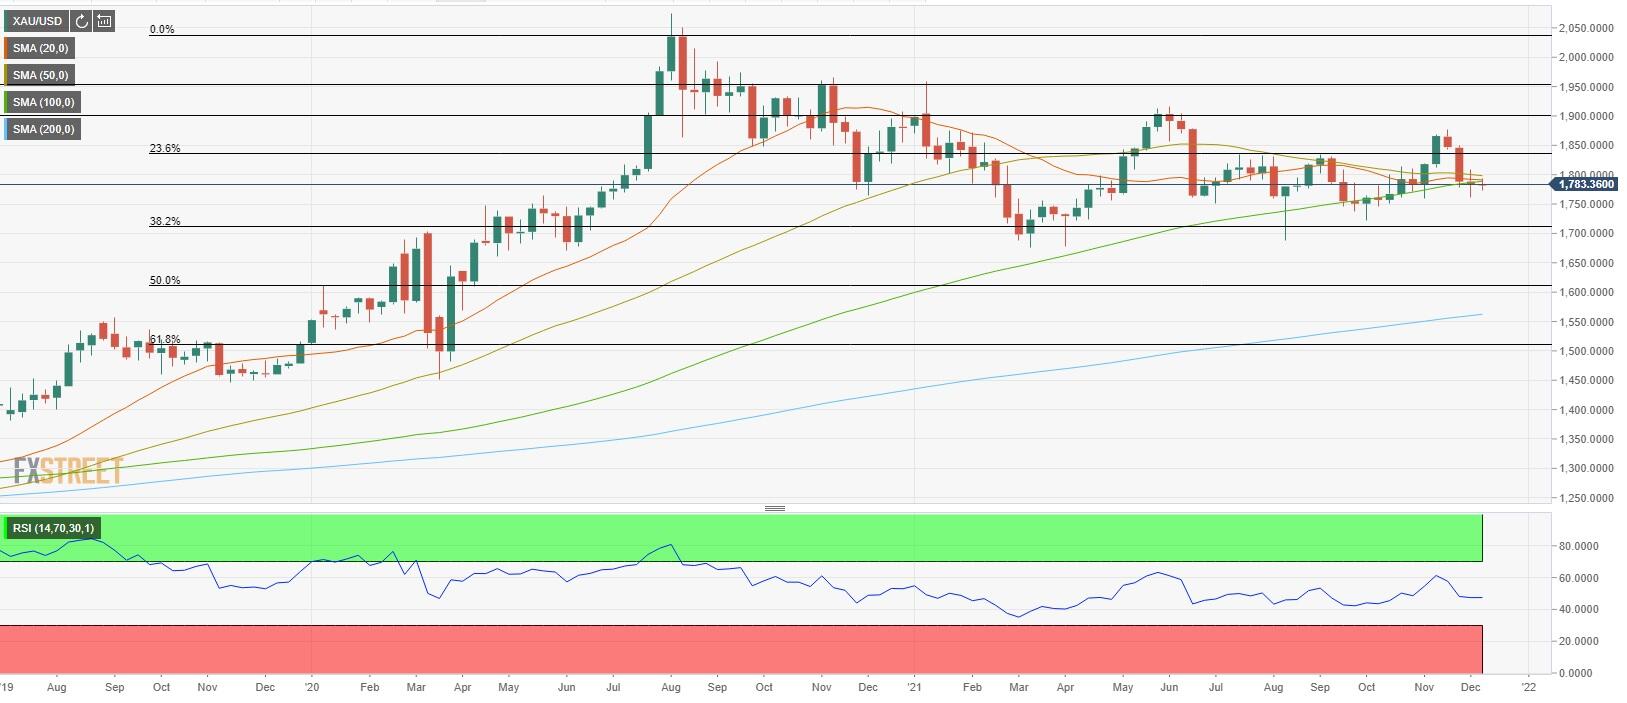
On the weekly chart, the Relative Strength Index (RSI) indicator is moving sideways near 50, punctuating gold’s indecisiveness. Additionally, the 20-week, the 50-week and the 100-week SMAs are flat around $1,800, where gold is trading in early December.
We have already established that if gold rises to $1,900 and the 10-year US T-bond yield starts rising from 1.2% simultaneously it could be seen as a selling opportunity. On the flip side, buyers could come in near $1,700 if the 10-year yield turns south following a failure to break above 1.75%.
What happens if gold manages to break out of that range? First of all, gold needs to make a weekly close above $1,900 or below $1,700 to confirm a breakout. Second of all, the weekly RSI would need ideally to be near 60 or 40, respectively, when that happens. Finally, investors are likely to be convinced of a breakout if it’s accompanied by a breakout in yields.
Assuming these conditions are met, what are the target levels for gold? On the upside, $1,950 aligns as first initial resistance. In November 2020, gold gained nearly 4% in a week and rose sharply toward that level before reversing its direction and losing more than 8% in the ensuing three weeks. If gold overcomes that hurdle, bulls could target $2,000 (psychological level) and $2,050, the endpoint of the long-term uptrend that started in August 2018.
On the downside, significant support seems to have formed at $1,600 (Fibonacci 50% retracement level of the long-term uptrend, psychological level) ahead of $1,560 (200-week MA).
What do experts think?
FXStreet Senior Analyst Dhwani Mehta thinks that gold is likely to remain rangebound between $1,700 and $1,900 in 2022.
“I assume gold is sold on rallies as its status as 'inflation hedge' is likely to be outweighed by the global tightening spree. Which seems to accelerate in H2 2022 worldwide,” Mehta notes. “So all-time highs of $2075 is nowhere on the table for 2022. Gold could more or less maintain its range between $1700-$1900, with deeper declines seen below the longer-term support of $1,700.”
Similarly, FXStreet Senior Analyst Valeria Bednarik sees gold sliding toward $1,700 after failing to hold above $1,800.
“I do think that the dollar does have more to offer, particularly against gold and other metals, although I still can't see a clear oil slump,” says Bednarik. “Gold seems to be offering better possibilities at the time being, en route to November's low at $1,758.81. A break below the level could see a quick slide towards the $1,700 figure after repeated failure at $1,800.”
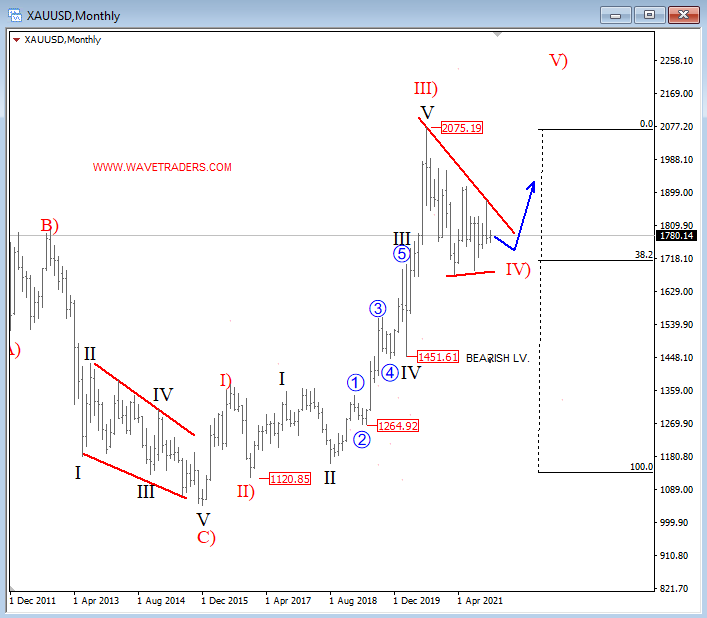
Gregor Horvat projects a bullish continuation for the XAU/USD pair on his Elliott Wave analysis:
XAU/USD Elliott Wave Analysis

Gold is bullish, with no five waves up in play yet, so there is no reason to fight a trend, especially not when you have slow and choppy price action around the highs, which is normally a corrective move. We see that as wave IV) that suggests more upside into wave V) next year.
Forecast Poll 2022
| Forecast | Q1 - Mar 31st | Q2 - Jun 30th | Q4 - Dec 31st |
|---|---|---|---|
| Bullish | 8.33% | 0% | 8.33% |
| Bearish | 8.33% | 91.66% | 16.66% |
| Sideways | 83.33% | 8.33% | 75% |
| Average Forecast Price | 1776.9167 | 1772.7500 | 1749.7500 |
| EXPERTS | Q1 - Mar 31st | Q2 - Jun 30th | Q4 - Dec 31st |
|---|---|---|---|
| Alberto Muñoz | 1760.0000 Sideways | 1675.0000 Sideways | 1550.0000 Bearish |
| Andrew Lockwood | 1800.0000 Sideways | 1706.0000 Sideways | 1700.0000 Sideways |
| Brad Alexander | 1800.0000 Sideways | 1900.0000 Sideways | 1750.0000 Sideways |
| Brian Wang | 1759.0000 Sideways | 1706.0000 Sideways | 1646.0000 Sideways |
| Frank Walbaum | 1700.0000 |