GBP/USD Must break 1..30 or 1.32
The GBP/USD showed strong bullish price action on Friday but it did not invalidate the wave 2 (blue) pattern as price failed to break above the 100% Fibonacci level. What is the next step for the Cable?
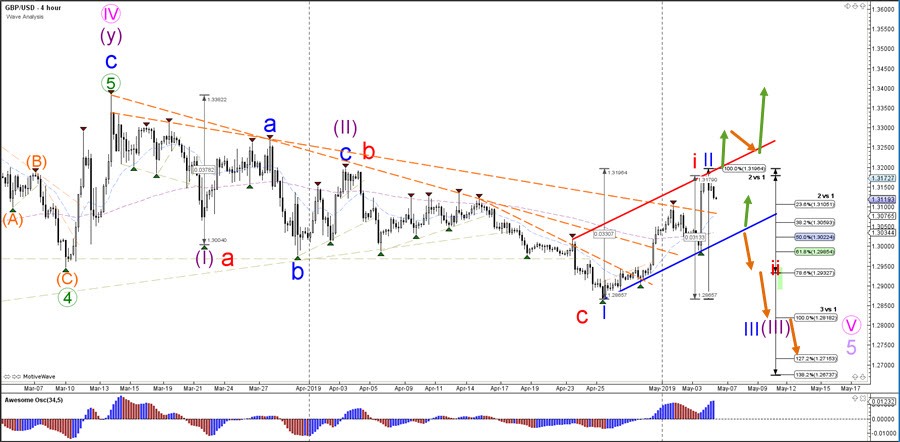
GBP/USD
4 hour
The GBP/USD could still be in the wave 1-2 (blue) pattern but this outlook has become less probable after the large spike up. The alternative is a bullish wave 1-2 (red) pattern after price completed a bearish ABC (red) pattern. The correct wave pattern will depend on the breakout of the trend channel. A bullish break above the resistance (red) indicates an uptrend whereas a break below the support (blue) indicates a downtrend.
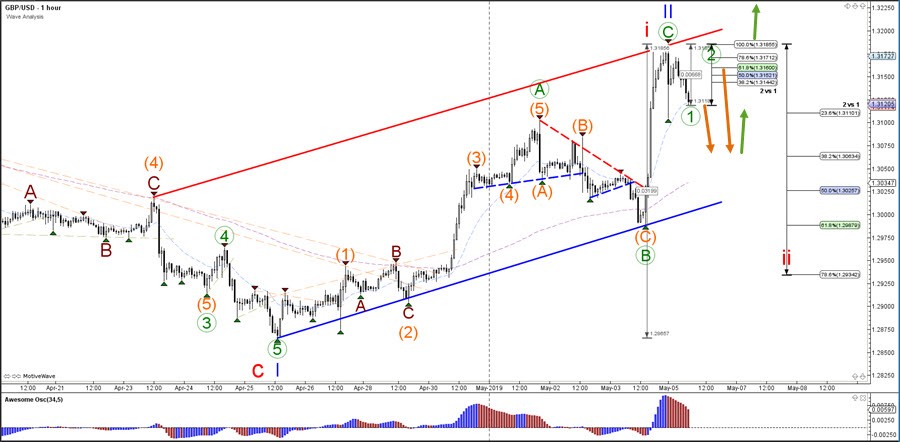
1 hour
The GBP/USD could have completed a potential bullish ABC (green) pattern if price manages to make a wave 1-2 (green) pattern and bearish reversal in this zone. However, a break above the 1.3186 indicates that price probably made 5 waves up (rather than an ABC) and also means that price is undergoing a trend change and invalidating both waves 1-2 (blue/green). For the moment, the GBP/USD remains in a difficult spot and needs to move substantially lower or higher to confirm/invalidate one of the wave patterns.
The analysis has been done with the CAMMACD.MTF template.
For more daily wave analysis and updates, sign-up up to our ecs.LIVE channel.
Author

Chris Svorcik
Elite CurrenSea
Experience Chris Svorcik has co-founded Elite CurrenSea in 2014 together with Nenad Kerkez, aka Tarantula FX. Chris is a technical analyst, wave analyst, trader, writer, educator, webinar speaker, and seminar speaker of the financial markets.


