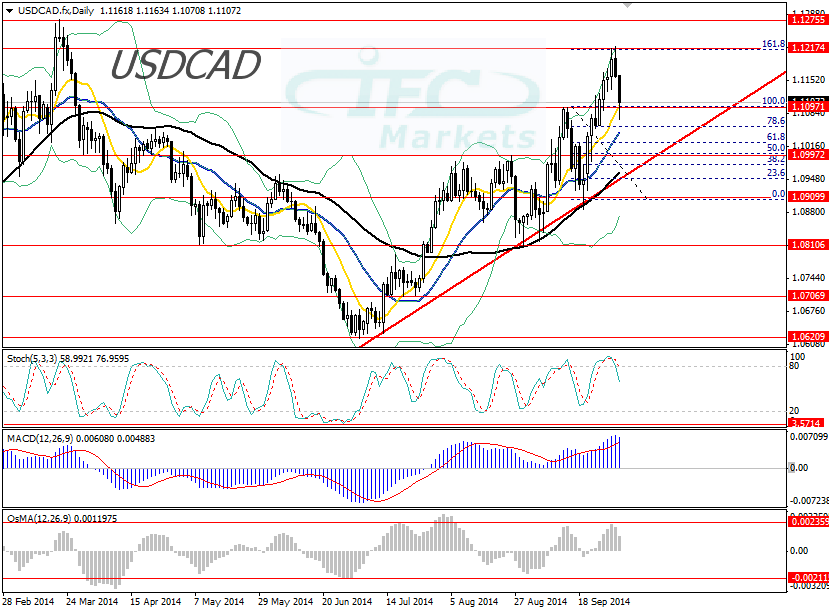
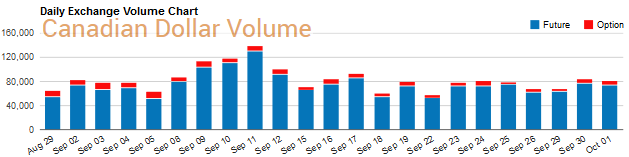
Hello, dear traders. Today we are going to look into the US dollar against the Canadian dollar chart pattern. In the last trading sessions upside bias drove prices to recent cap at 1.1217 and in the last two daily trading sessions prices retreated due to overbought indicators. The cap at 1.1217 could be a strong one since is at the 161.8% Fibonacci level of the retracement from 1.1097 to 1.0909. Moreover, the Simple Moving Averages are below prices which increase upside momentum and the valid rising trend line remains in place confirming bullish development. Based on the price pattern we could see a pull back at the support at 1.0997 andwe could take advantage of that retracement although is too risky ahead of the Non-Farm Payrolls release. Yesterday the release of private employment showed higher job creation in September and that gives a signal of a possible stronger NFP in September as well. We should check oscillators and volume for further clues before establishing an opinion.
Recommended Content
Editors’ Picks
EUR/USD edges lower toward 1.0700 post-US PCE

EUR/USD stays under modest bearish pressure but manages to hold above 1.0700 in the American session on Friday. The US Dollar (USD) gathers strength against its rivals after the stronger-than-forecast PCE inflation data, not allowing the pair to gain traction.
GBP/USD retreats to 1.2500 on renewed USD strength

GBP/USD lost its traction and turned negative on the day near 1.2500. Following the stronger-than-expected PCE inflation readings from the US, the USD stays resilient and makes it difficult for the pair to gather recovery momentum.
Gold struggles to hold above $2,350 following US inflation

Gold turned south and declined toward $2,340, erasing a large portion of its daily gains, as the USD benefited from PCE inflation data. The benchmark 10-year US yield, however, stays in negative territory and helps XAU/USD limit its losses.
Bitcoin Weekly Forecast: BTC’s next breakout could propel it to $80,000 Premium

Bitcoin’s recent price consolidation could be nearing its end as technical indicators and on-chain metrics suggest a potential upward breakout. However, this move would not be straightforward and could punish impatient investors.
Week ahead – Hawkish risk as Fed and NFP on tap, Eurozone data eyed too

Fed meets on Wednesday as US inflation stays elevated. Will Friday’s jobs report bring relief or more angst for the markets? Eurozone flash GDP and CPI numbers in focus for the Euro.