Chinese Stock Woes:
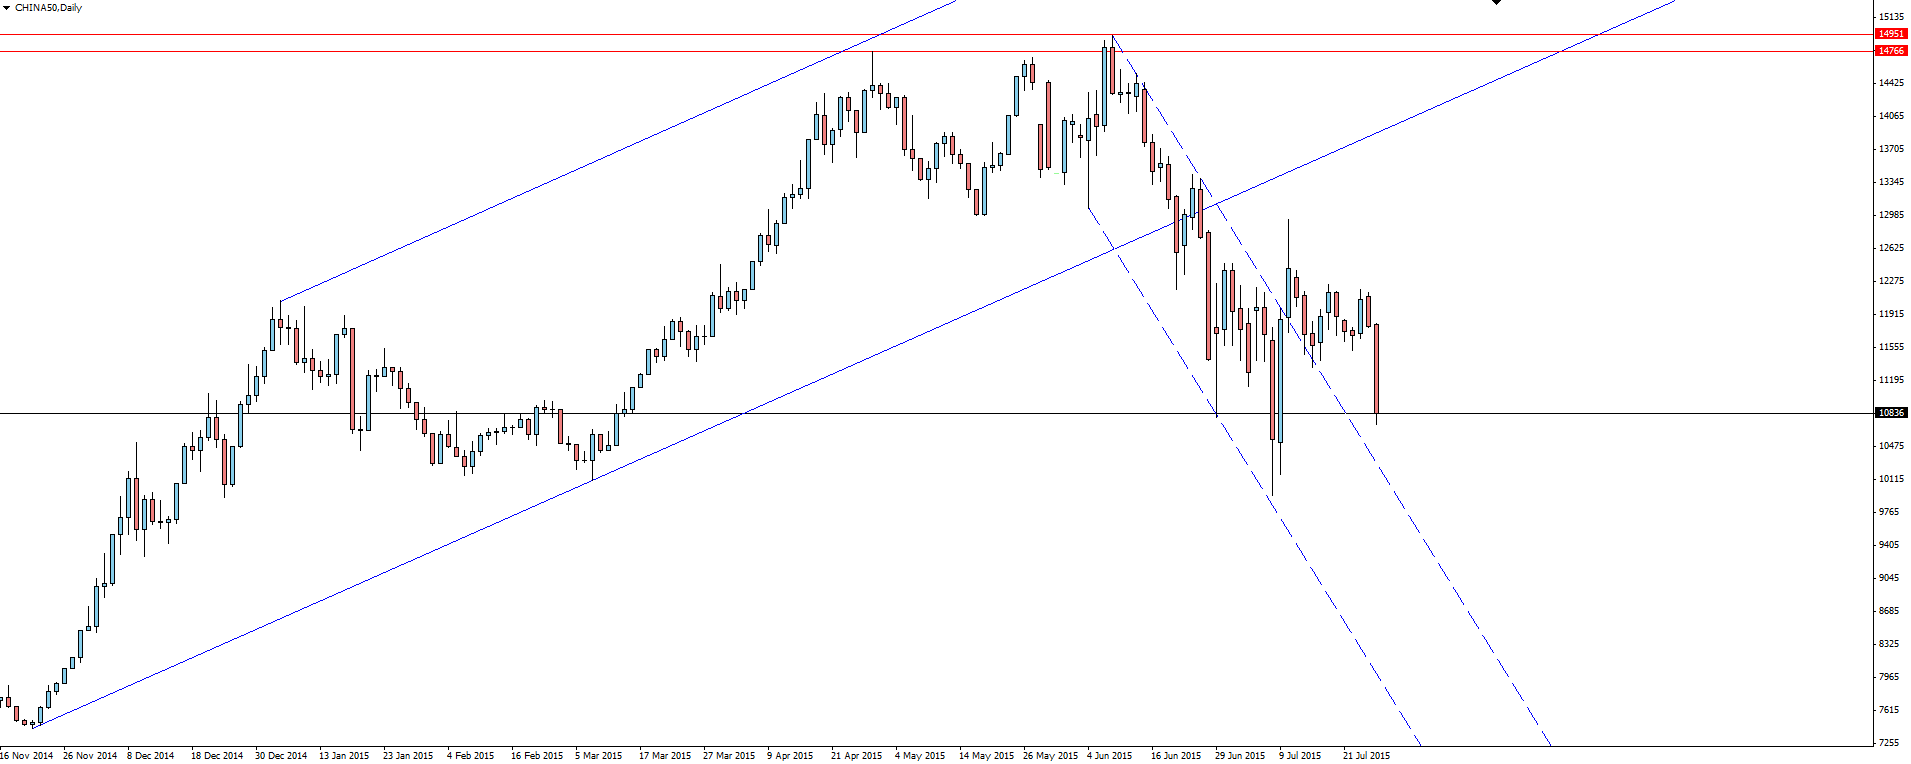
After what seemed like a settled week, Chinese stocks were back in the news overnight with some massive falls ripping through markets. The Shanghai Composite Index capitulated, suffering an 8.5% loss on the day, its worst performance since February 2007!
This drop was on the back of concerns that the Chinese government is faltering on its measures to artificially prop up the market.
“Investors are not confident that the bull market will return any time soon.”
Confidence in the market is completely shot and we are going to see a few more wild swings yet to come. The manipulation of the market that the Chinese government is undertaking as well as the ever unreliable data releases described by some traders on social media as the government ‘spinning the random number generator’ has done nothing to ease concerns.
CHINA50 Daily:
Click on chart to see a larger view.
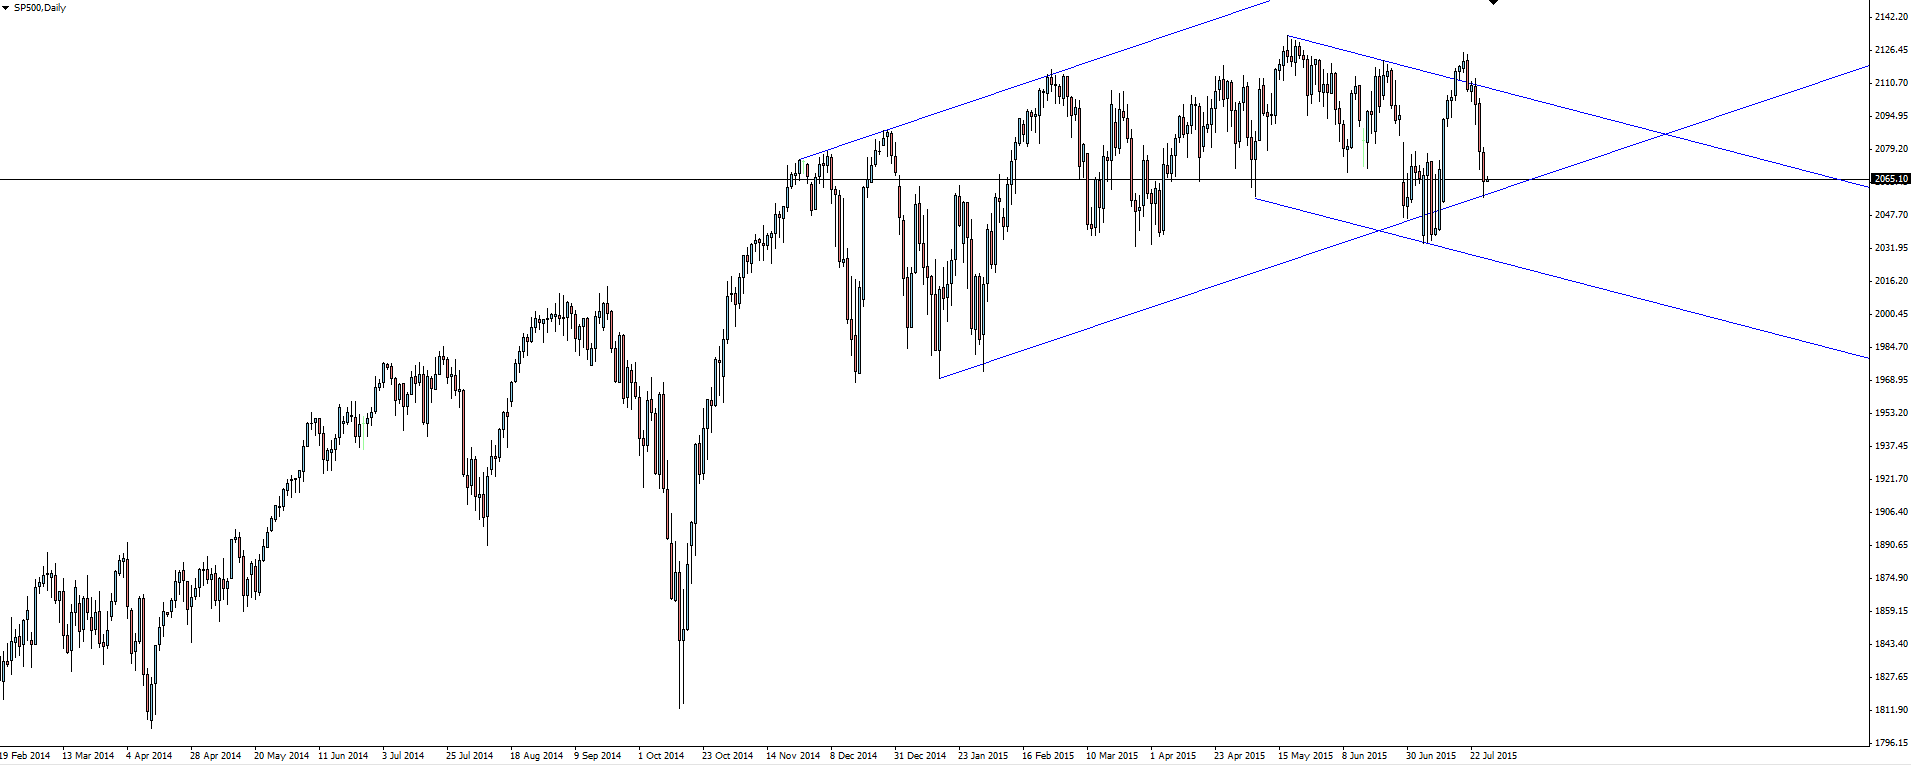
These sharp moves in China are also felt across the globe with US markets feeling the pinch. With FOMC jitters and corporate earnings spurring on the declines, a loss of confidence in China has not helped matters, sending the SP500 well off its highs down to significant channel support.
SP500 Daily:
Click on chart to see a larger view.
———-
On the Calendar Tuesday:
GBP Prelim GDP
USD CB Consumer Confidence
———-
Chart of the Day:
As its FOMC week, we have been looking at the majors heading into Wednesday’s meeting. Its AUD/USD’s turn today as we take a look at the weekly and daily charts below.
AUD/USD Weekly:
Click on chart to see a larger view.
What a fall from grace the Aussie has suffered. The good old days for Aussie tourists getting $1.10 in the US are certainly long forgotten.
More recently, price had a bit of a pause between 75 and 80c but that was short lived as yet another major support level crumbled to get where we currently sit.
This marked level that price is approaching is massively important, being both major weekly trend line support dating back 14 years to 2001, while also lining up with (relatively) short term channel support dating back to the change of trend when price came off its highs in 2012.
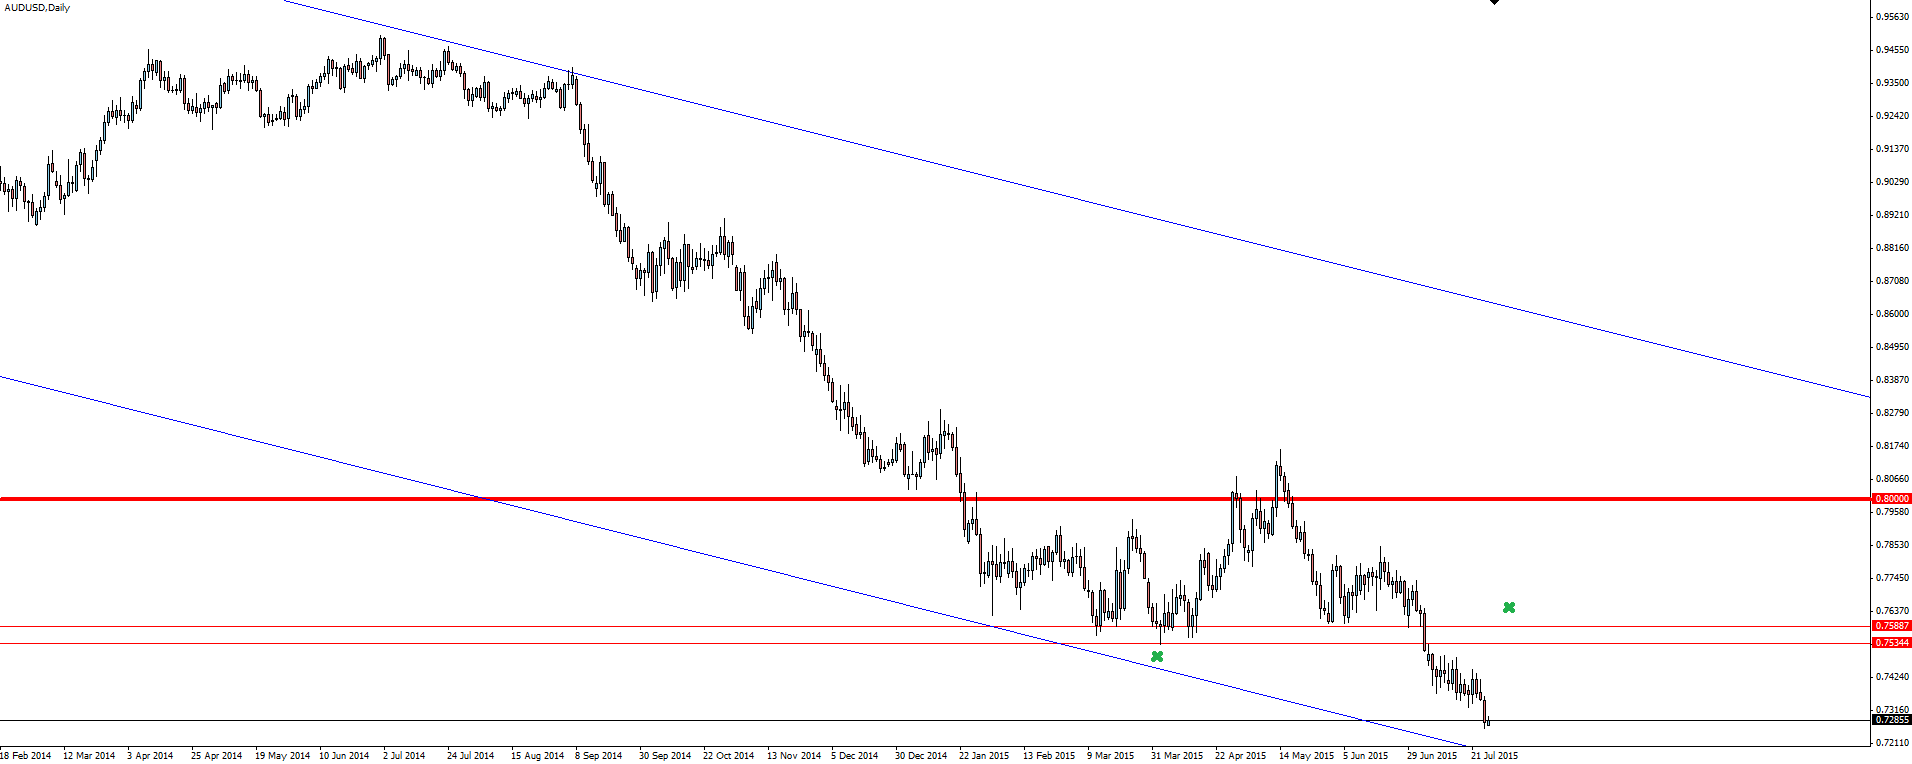
AUD/USD Daily:
Click on chart to see a larger view.
Zooming into the daily, price is currently in a bit of a ‘no mans land’, sitting between trend line support and the marked horizontal support/resistance level that could be used to manage your risk from the short side.
If the Fed rhetoric isn’t as hawkish as expected and it looks like more delays on interest rate hikes, price will bounce and the horizontal resistance zone around the 75c level will come into play. If you’re still a USDX bull then this is a nice area to manage your risk around and possibly short into it.
However, if hikes are as imminent as many economists are predicting, then the major weekly support level could be in danger. I can’t stress enough just how significant this confluence of weekly support is and even on the back of a hawkish Fed, we could see a bit of sell the rumour, buy the news come into play on AUD/USD.
Recommended Content
Editors’ Picks
EUR/USD edges lower toward 1.0700 post-US PCE

EUR/USD stays under modest bearish pressure but manages to hold above 1.0700 in the American session on Friday. The US Dollar (USD) gathers strength against its rivals after the stronger-than-forecast PCE inflation data, not allowing the pair to gain traction.
GBP/USD retreats to 1.2500 on renewed USD strength

GBP/USD lost its traction and turned negative on the day near 1.2500. Following the stronger-than-expected PCE inflation readings from the US, the USD stays resilient and makes it difficult for the pair to gather recovery momentum.
Gold struggles to hold above $2,350 following US inflation

Gold turned south and declined toward $2,340, erasing a large portion of its daily gains, as the USD benefited from PCE inflation data. The benchmark 10-year US yield, however, stays in negative territory and helps XAU/USD limit its losses.
Bitcoin Weekly Forecast: BTC’s next breakout could propel it to $80,000 Premium

Bitcoin’s recent price consolidation could be nearing its end as technical indicators and on-chain metrics suggest a potential upward breakout. However, this move would not be straightforward and could punish impatient investors.
Week ahead – Hawkish risk as Fed and NFP on tap, Eurozone data eyed too

Fed meets on Wednesday as US inflation stays elevated. Will Friday’s jobs report bring relief or more angst for the markets? Eurozone flash GDP and CPI numbers in focus for the Euro.