EUR/USD
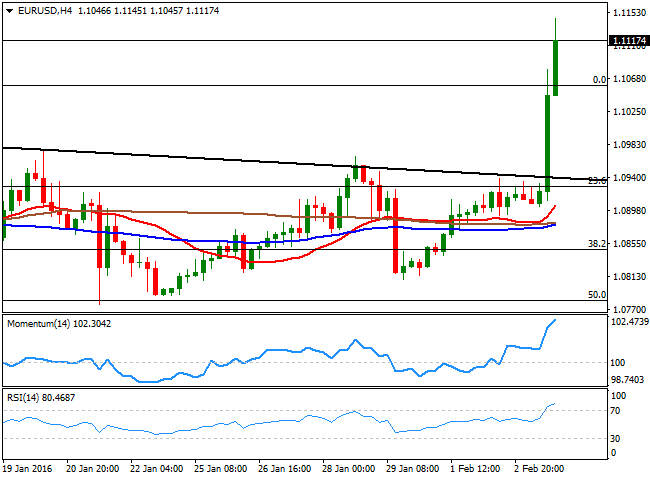
The dollar soldoff this Wednesday, with the decline fueled by tepid local data, and comments from FED's Dudley, who said that financial conditions have tightened since the Fed raised interest rates in December, diminishing dramatically chances of four rate hikes coming from the US Central Bank this year. The release of the US services PMI figures fueled the decline, as according to Markit economics, the US services activity growth eased to its weakest for 27 months in January, by printing 53.2. The official figure, the ISM Nonmanufacturing PMI for the same month, fell to 53.5 from December's 55.3. The ADP survey showed that the private sector added 205K new jobs in January, beating expectations of 195K, growing at the slowest pace since October. Things are not better in Europe, with weak services PMIs readings and poor EU Retail Sales in December, up just 0.3% in the month. Seems speculators believe they may have rushed to price in the 4 rate hikes promised by the FED, and are quickly unwinding positions.The EUR/USD pair rallied beyond the 1.1100 figure for the first time since past October, and set at 1.1145,having advanced almost 250 pips daily basis, the best EUR performance ever since the December ECB's announcement of a QE extension. The pair has broken beyond its 200 DMA, at 1.1050, now a major support level. In the 4 hours chart, the technical indicators are barely losing upward strength in extreme overbought territory, while the price is far above its moving averages, after the intraday run. The pair has briefly extended beyond a major static resistance around 1.1120, which should contain rallies at least in the short term. Renewed buying interest above it, however, will likely fuel the rally towards the 1.1200 region, the main bullish target for this Thursday.
Support levels:1.1050 1.1010 1.0970
Resistance levels: 1.1120 1.1160 1.1200
GBP/USD
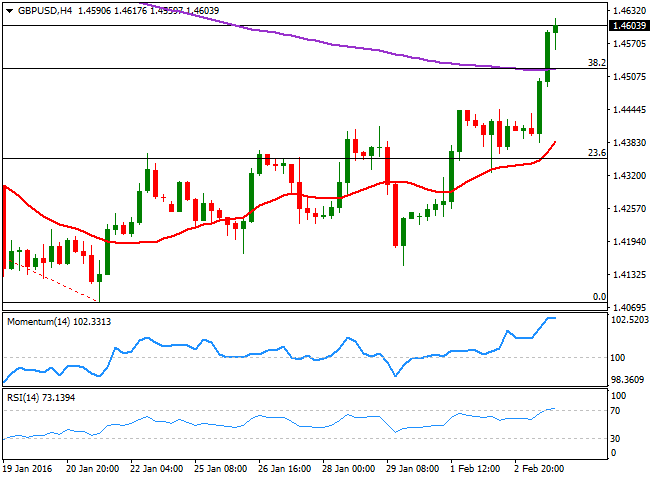
The GBP/USD trades at fresh 4weeks highs, a handful of pips above the 1.4600 figure. The Pound got an early boost during the European morning, as the Markit services PMI report for January showed that the sector continue to lead the UK recovery, up to 55.6 against the 55.5 previous, and the 55.3 expected. The pair's rally accelerated after breaking above 1.4530, which stands for the 38.2% retracement of the 1.5110/1.4078 decline between December and January. Short term, the 1 hour chart shows that the 20 SMA advanced alongside with the price, but stands well below the current level, while the technical indicators resumed their advances within extreme overbought territory. In the 4 hours chart, the technical indicators are losing upward extreme in overbought territory, the 20 SMA heads higher far below the current level, and the 200 EMA converges with the mentioned Fibonacci level at 1.4530, first time above it since mid December. Retracements down to this last level should be now seen as buying opportunities, while additional gains can be confirmed on a break above 1.4660, the 50% retracement of the mentioned decline.
Support levels:1.4530 1.4490 1.4450
Resistance levels: 1.4565 1.4600 1.4640
USD/JPY
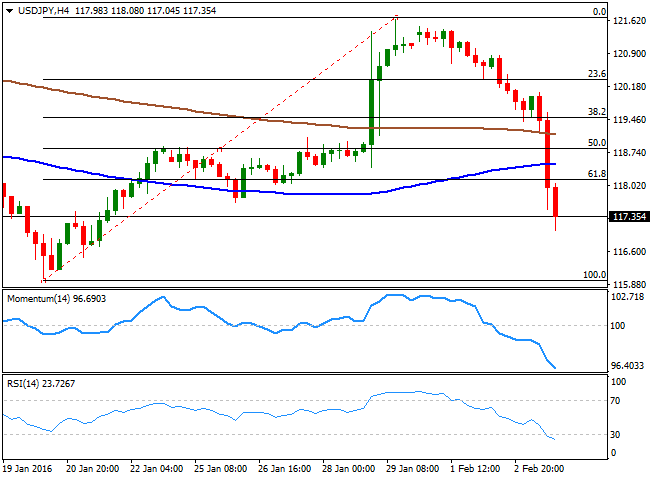
The Japanese yen rally seems unstoppable, with the USD/JPY pair down over 270 pips this Wednesday, and now trading around 117.34, its lowest since January 21st. Risk aversion is supporting yen's strength, but also falling US yields, as 10y ones are at 1.85%, 0.48% lower in the day. The 1 hour chart for the pair shows that the technical indicators maintain strong bearish slopes below their midlines, while the price plunged below its 100 and 200 SMAs. It also shows that the price is bouncing from a daily low seta t 117.04, but remains below 117.65, January 26th daily low and the immediate resistance. In the 4 hours chart, the technical indicators maintain their sharp bearish slopes within extreme oversold levels, while the price retraced over 61.8% of its latest daily bullish run between 115.96 and 121.68, pointing for a continued decline towards the low of the range.
Support levels:117.05 116.60 116.20
Resistance levels:117.65 117.90 118.40
GOLD
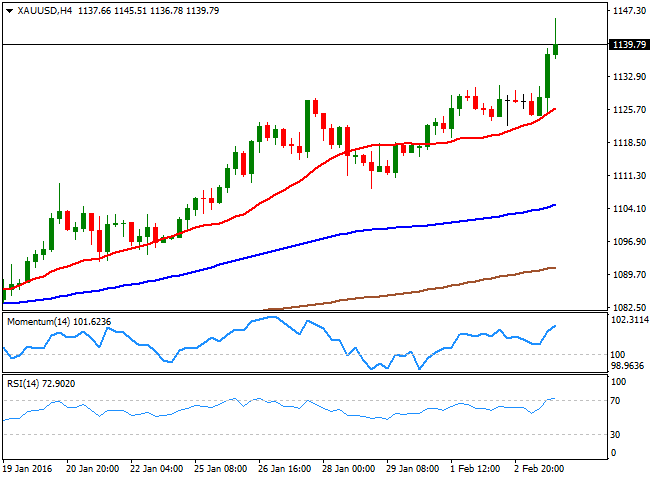
Gold prices advanced on Wednesday as the US dollar weakened across the board, with spot reaching its highest level since October 30th at $1,145.51 an ounce, before correcting slightly. The yellow metal ended the day at $1,141 an ounce at the Comex, its highest close in over three months. There were no clear catalysts for the slump witnessed in the US dollar, although dovish comments from Fed’s Dudley ignited the downward move at the beginning of the New York session, while disappointing ISM services PMI fueled the decline. The bright metal continues developing its newly born bullish trend, and the daily chart for spot shows that the price extended further beyond its 200 DMA, while the technical indicators have resumed their advances and maintain healthy bullish slopes near overbought levels. In the 4 hours chart, the 20 SMA heads north around 1,125.60, providing a strong support in the case of a downward correction, while the technical indicators have turned flat near overbought readings, rather reflecting the late pullback than suggesting that the upside is exhausted.
Support levels:1,134.90 1,125.60 1,115.80
Resistance levels:1,145.50 1,153.70 1,160.00
WTI CRUDE
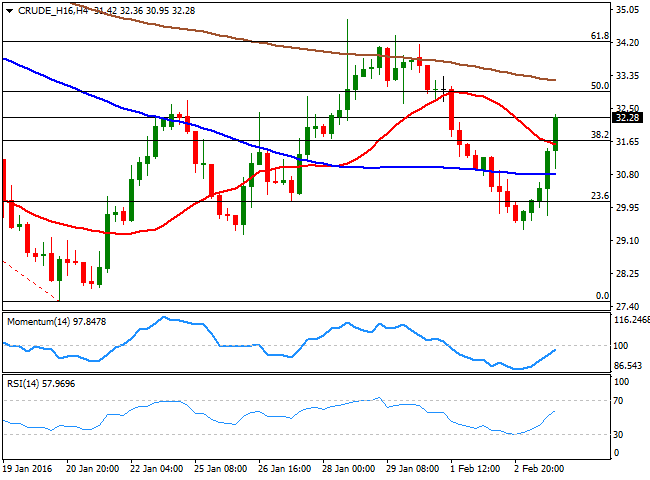
Crude oil prices soared on dollar's weakness, and in spite of a large increase in US stocks. WTI futures surged up to $32.36 a barrel, while Brent futures advanced above $35.00 on comments from Russia's Foreign Minister expressing its willingness to meet with OPEC and nonOPEC members to discuss an output reduction, reigniting hopes of a deal to trim production. In the US, the EIA report showed that US crude stockpiles increased by 7.8 million barrels last week, against expectations of a 4.8 million gain. The commodity is at its highest since Feb 1st, having rallied beyond the 38.2% retracement of its latest daily decline between 38.37 and 27.35 at 31.65, the immediate support. In the daily chart, the price recovered above its 20 SMA, while the technical indicators are heading north, albeit the RSI indicator is still below the 50 level. In the 4 hours chart, the price has also advanced above a now bearish 20 SMA, while the technical indicators head higher, the Momentum still below 100 and the RSI around 57. Despite dollar's weakness, investors are still reluctant to go long in the commodity, given that the background reasons of the latest slump remain firm in place.
Support levels:31.65 31.00 30.40
Resistance levels:32.35 32.95 33.60
DAX
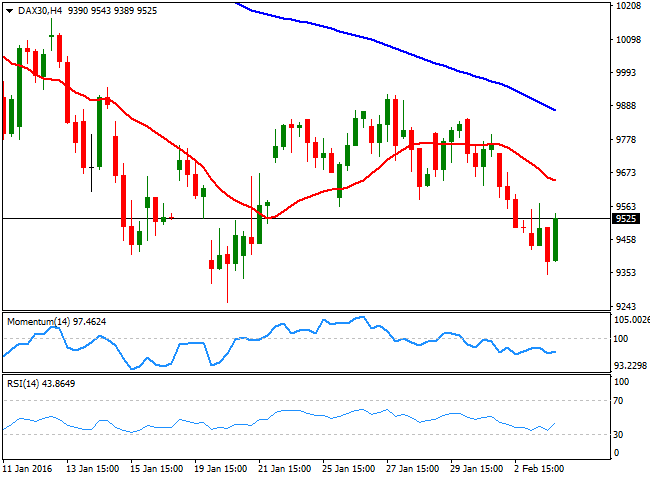
European stocks closed the day sharply lower, despite oil surged, with the energyrelated equities losing the most, after US stockpiles rose to levels not seen since 2003. The commodity's intraday recovery was backed by dollar's weakness, and most market players see it as temporal, as the economic slowdown seems to be spreading now towards the US. The German DAX closed the day at 9,434.82, down by 143 points or 1.53%. The index followed Wall Street in electronic trading, plummeting further to 9,347, but later recovering near 9,500, where it stands. From a technical point of view, the daily chart retains the bearish tone seen on previous updates, with the index well below its 20 SMA and the technical indicators heading south below their midlines. In the 4 hours chart, the technical indicators are turning slightly higher, but remain below their midlines, while the 20 SMA has turned south well above the current level, providing a strong resistance in the case of further recoveries, around 9,659.
Support levels:9,410 9,335 9,256
Resistance levels: 9,543 9,659 9,718
DOW JONES
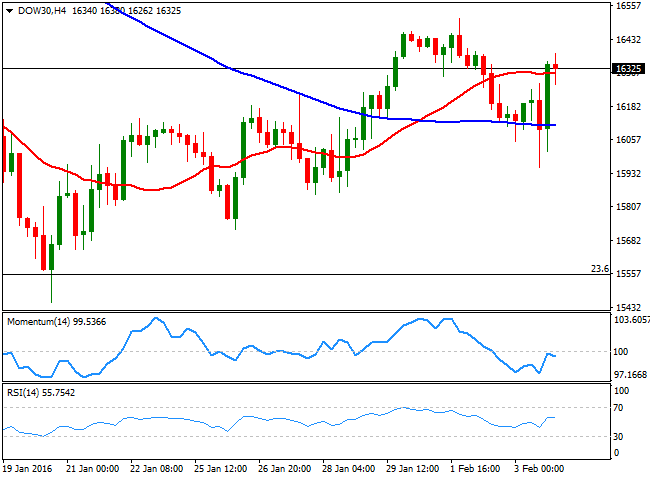
Wall Street was in a rollercoaster ride this Wednesday, with the DJIA posting a triple digit decline before reversing in the last trading hours, trading briefly up around 250 points before closing higher, as an 8% gain in WTI futures, led energy and commodities sectors higher. Tech giants Google, Yahoo, Amazon all declined 4% or more. The DJIA closed 183 points higher at 16,336.66, the Nasdaq down 0.28% to 4,504.24, while the SandP advanced 0.50% to 1,912.53. Despite a long wick below it, the daily candle shows that the index has opened and closed the day above its 20 SMA, a major intraday support around 16,133, while the technical indicators have bounced from their midlines, maintaining bullish slopes, but with limited upward strength. In the 4 hours chart, the index is barely above a horizontal 20 SMA, but the technical indicators have lost upward strength around their midlines, and are currently turning south, not yet confirming a short term bearish continuation.
Support levels:16,262 16,205 16,133
Resistance levels: 16,378 16,454 16,510
FTSE 100
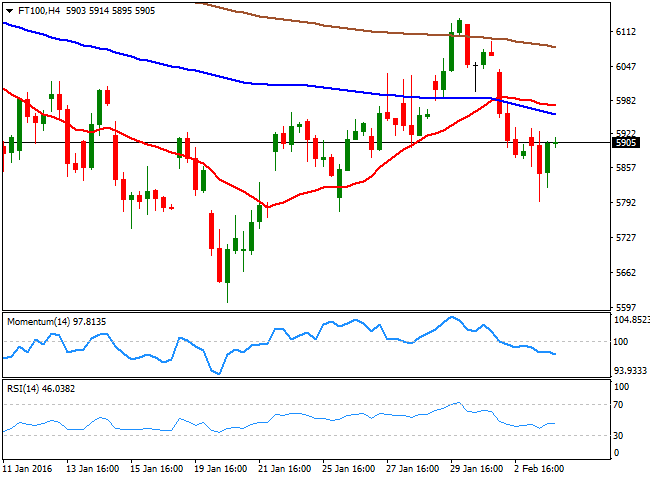
The FTSE 100 extended its decline on Wednesday, down 1.43% to close at 5,837.14. Risk sentiment dominated the European session, and in London, financial stocks led the way lower, with Standard Chartered down to an 18year low, down by 3.9%, after Citigroup slashed its target price. Hargreaves Lansdown was also among top fallers following a mixed earnings update, down by 3.4%, despite saying that first half assets under administration hit a record high on the back of strong new business inflows. Currently trading around 5,900, the daily chart for the London benchmark shows that the index is hovering around a bearish 20 SMA, while the Momentum indicator heads lower below its 100 level and the RSI indicator hovers around 46, lacking directional strength. In the 4 hours chart, the technical picture also favors the downside as the technical indicators head south within bearish territory, while the index remains below its moving averages, in line with the longer term perspective.
Support levels:5,876 5,820 5,765
Resistance levels: 5,933 5,990 6,042
The information set forth herein was obtained from sources which we believe to be reliable, but its accuracy cannot be guaranteed. It is not intended to be an offer, or the solicitation of any offer, to buy or sell the products or instruments referred herein. Any person placing reliance on this commentary to undertake trading does so entirely at their own risk.
Recommended Content
Editors’ Picks
EUR/USD edges lower toward 1.0700 post-US PCE

EUR/USD stays under modest bearish pressure but manages to hold above 1.0700 in the American session on Friday. The US Dollar (USD) gathers strength against its rivals after the stronger-than-forecast PCE inflation data, not allowing the pair to gain traction.
GBP/USD retreats to 1.2500 on renewed USD strength

GBP/USD lost its traction and turned negative on the day near 1.2500. Following the stronger-than-expected PCE inflation readings from the US, the USD stays resilient and makes it difficult for the pair to gather recovery momentum.
Gold struggles to hold above $2,350 following US inflation

Gold turned south and declined toward $2,340, erasing a large portion of its daily gains, as the USD benefited from PCE inflation data. The benchmark 10-year US yield, however, stays in negative territory and helps XAU/USD limit its losses.
Bitcoin Weekly Forecast: BTC’s next breakout could propel it to $80,000 Premium

Bitcoin’s recent price consolidation could be nearing its end as technical indicators and on-chain metrics suggest a potential upward breakout. However, this move would not be straightforward and could punish impatient investors.
Week ahead – Hawkish risk as Fed and NFP on tap, Eurozone data eyed too

Fed meets on Wednesday as US inflation stays elevated. Will Friday’s jobs report bring relief or more angst for the markets? Eurozone flash GDP and CPI numbers in focus for the Euro.
