Fed speak day [Video]
![Fed speak day [Video]](https://editorial.fxstreet.com/images/Macroeconomics/CentralBanks/FED/Jerome Powell 1Fed__XtraLarge.jpg)
US Dollar: Dec '20 USD Up at 93.725.
Energies: Nov'20 Crude is Down at 40.26.
Financials: The Dec '20 30 year bond is Up 21 ticks and trading at 176.01.
Indices: The Dec S&P 500 emini ES contract is 168 ticks Lower and trading at 3439.00.
Gold: The Dec'20 Gold contract is trading Down at 1893.80 Gold is 120 ticks Lower than its close.
Initial Conclusion
This is not a correlated market. The dollar is Up+ and Crude is Down- which is normal and the 30 year Bond is trading Higher. The Financials should always correlate with the US dollar such that if the dollar is lower then bonds should follow and vice-versa. The S&P is Lower and Crude is trading Lower which is not correlated. Gold is trading Lower which is correlated with the US dollar trading Up. I tend to believe that Gold has an inverse relationship with the US Dollar as when the US Dollar is down, Gold tends to rise in value and vice-versa. Think of it as a seesaw, when one is up the other should be down. I point this out to you to make you aware that when we don't have a correlated market, it means something is wrong. As traders you need to be aware of this and proceed with your eyes wide open.
All of Asia traded Lower. All of Europe is trading Lower at this time.
Possible Challenges To Traders Today:
-
Philly Fed Manufacturing Index is out at 8:30 AM EST. This is Major.
-
Unemployment Claims is out at 8:30 AM EST. This is Major.
-
Empire State Manufacturing Index is out at 8:30 AM EST. Major.
-
Import Prices m/m is out at 8:30 AM EST. Major.
-
Natural Gas Storage is out at 10:30 AM EST. This is Major.
-
Crude Oil Inventories is out at 11 AM EST. Major.
-
FOMC Member Kaplan Speaks at 11 AM EST. This is Major.
-
FOMC Member Quarles Speaks at 11 AM EST. This is Major.
Treasuries
Traders please note that we've changed the Bond instrument from the 30 year (ZB) to the 10 year (ZN). They work exactly the same.
We've elected to switch gears a bit and show correlation between the 10 year bond (ZN) and The S&P futures contract. The S&P contract is the Standard and Poor's and the purpose is to show reverse correlation between the two instruments. Remember it's liken to a seesaw, when up goes up the other should go down and vice versa.
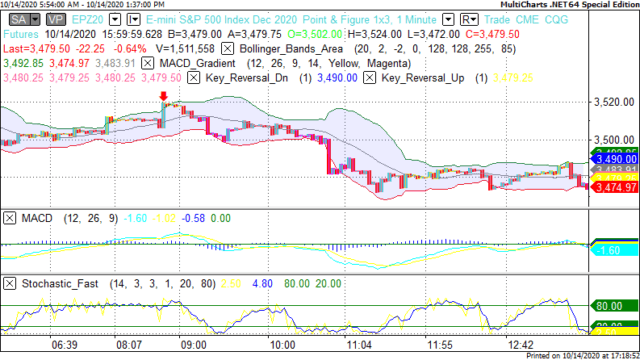
Yesterday the ZN made it's move at around 9 AM EST. The ZN hit a Low at around that time and the S&P moved Lower. If you look at the charts below ZN gave a signal at around 9 AM EST and the S&P moved Lower at around the same time. Look at the charts below and you'll see a pattern for both assets. ZN hit a Low at around 9 AM EST and the S&P was moving Lower shortly thereafter. These charts represent the newest version of MultiCharts and I've changed the timeframe to a 15 minute chart to display better. This represented a Long opportunity on the 10 year note, as a trader you could have netted about 10 ticks per contract on this trade. Each tick is worth $15.625. Please note: the front month for the ZN is now Dec '20. The S&P contract is also Dec '20 as well. I've changed the format to Renko bars such that it may be more apparent and visible.
Charts Courtesy of MultiCharts built on an AMP platform
Bias
Yesterday we gave the markets a Neutral bias as all the instruments we use for Correlation purposes were pointed Higher. The Dow fell by 166 points and the other indices lost ground as well. Today we aren't dealing with a correlated market and our bias is to the Downside.
Could this change? Of Course. Remember anything can happen in a volatile market.
Commentary
Yesterday we had PPI numbers that did not meet expectation and the markets reacted accordingly. We gave the markets a Neutral bias which means the markets could go in any direction and often does. We gave a Neutral bias as all the instruments that we use for Market Correlation purposes were all pointed Higher and whenever you have a situation where everything is pointed Higher or conversely everything is pointed Lower, there is no correlation hence the Neutral bias. Yesterday we had 4 FOMC members speaking and today we have two more plus Christine LaGarde, President of the European Central Bank. Even though Madame LaGarde is French, she is very astute in foreign financial affairs and spent time in the United States prior to the financial meltdown.
Author

Nick Mastrandrea
Market Tea Leaves


