Fed and NFP preview: GDP, inflation, XAU, WTI, Fed Funds
GDP and Inflation are the same lines and with only slight deviations between both. The 13 Year average before the last release ran Inlation at 2.62 Vs GDP at 2.27. Inflation over last 5 to 13 years trades above GDP or at low spreads.
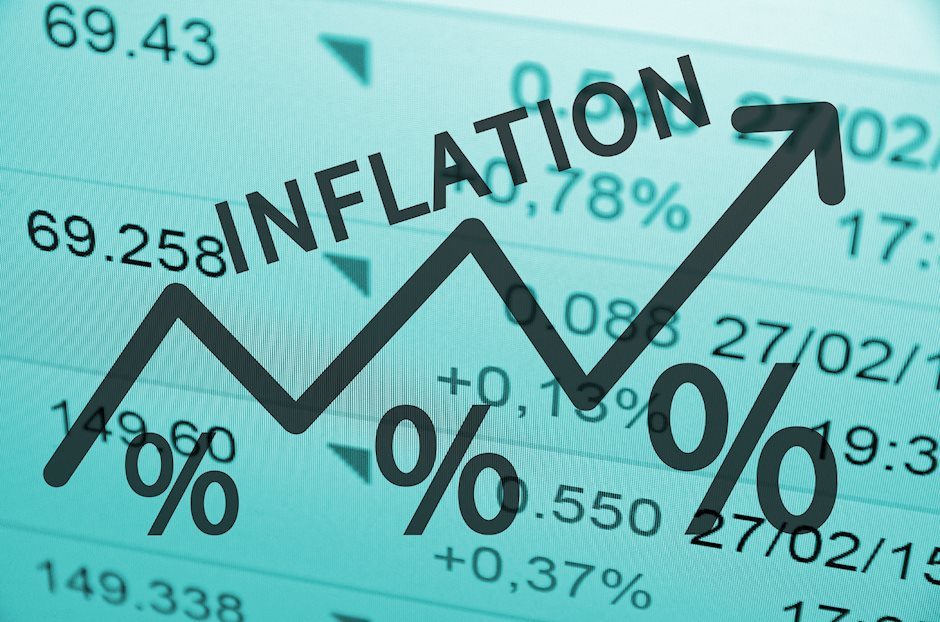
Inflation is the driving line to anticipate GDP. GDP must trade above Inflation in order for economies to run positive and growth oriented. Exports are the assistants to higher GDP.
GDP Vs Inflation runs a 13 year Correlation at +23%. For the 2 year average GDP = 3.04 Vs Inflation at 3.38. Slight changes exist due to the last GDP report at 1%. The 5 year average runs GDP at 3.84 Vs Inflation at 6.4.
GDP could rise 2 and 3 points but the rise is meaningless to Inflation at 6.4. Inflation averages run 3.47, 4.05, 4.58, 5.47, 5.72. GDP must break at minimum 3.47.
Below are GDP Vs Inflation spreads over 13 years to 2014.
2023 = Inflation 4.1 Vs GDP 2.5 = 1.6%.
2022 = Inflation 8.0% Vs GDP 1.9 = 6.1%.
2021 = Inflation 4.7 Vs GDP 5.8 = 1.1%.
2020 = Inflation 1.2 Vs GDP -2.2 = 3.4%.
2019 = Inflation 1.8 Vs GDP 2.5 = 0.7%.
2018 = Inflation 2.4 Vs GDP 3.0 = 0.6%.
2017 = Inflation 2.1 Vs GDP 2.5 = 0.4%.
2016 = Inflation 1.3 Vs GDP 1.8 = 0.5.
2015 = Inflation 0.1 Vs GDP 2.9 = 2.8.
2014 = Inflation 1.6 Vs GDP 2.5 = 0.9.
2013 = Inflation 2.5 Vs GDP 2.1 = 0.4.
2012 = Inflation 2.1 Vs GDP 2.3 = 0.2.
2011 = Inflation 3.2 Vs GDP 1.6 = 1.6.
2010 = Inflation 1.6 Vs GDP 2.7 = 1.1.
Average distance 1.52%.
Inflation Vs Fed Funds runs correlation 1 to 3 years at -86%, -96%, -63%. Fed Funds averages = 5.17, 3.62, 2.44, 1.89, 1.93.
Inflation Vs M1 Money Supply = +84%. Inflation Vs M2 Money Supply +52%. Higher Gold = Higher money supplies.
Inflation's true driver is Import and Export Lines as is Gold and WTI.
Inflation = WTI trade by correlations 1 to 5 years at -3%, +72%, +67%, +85%, +85%.
Inflation = XAU/USD trade by Correlation at -24%, -77%, +64%, -22%, +22%.
DXY will trade with Fed Funds by correlation at +41%, +13%, +56%, +64%, +62%.
NFP
NFP averages correlatate to Fed Funds at +90% and +80% across the board of averages.
NFP Averages 1 to 5 years = 167,337, 166,011, 164,613, 163,473, 163,532.
EUR/USD Vs DXY runs +90% correlation from 1 to 10 year averages.
Author

Brian Twomey
Brian's Investment
Brian Twomey is an independent trader and a prolific writer on trading, having authored over sixty articles in Technical Analysis of Stocks & Commodities and Investopedia.


