The Euro Stoxx 50 climbs 5.0 points or 0.13% reaching at 3,765.2 pts., FTSE MIB 40 surges 20 pts or 0.08% touching at 23,788 pts., Ibex 35 gains 1.0 pts or 0.01% touching at 9,512.7 pts.
The European stock market advances modestly on Thursday after the "phase one" deal agreement. However, the tariffs of some Chinese products would be removed depending on the progress on the "phase two" negotiations.
The U.S. President Donald Trump qualified the agreement signed between the two world's largest economies on Wednesday as a "great deal for both countries."
Some analysts showed confidence about this advance in the commercial relations between the U.S. and China. However, they still are expectant for the start of "phase two" kick-off negotiations.
Technical Overview
The FTSE MIB 40 in its daily chart exposes the upward movement developed by the Italian index in three segments. The ascending move could correspond to an ending diagonal in progress.
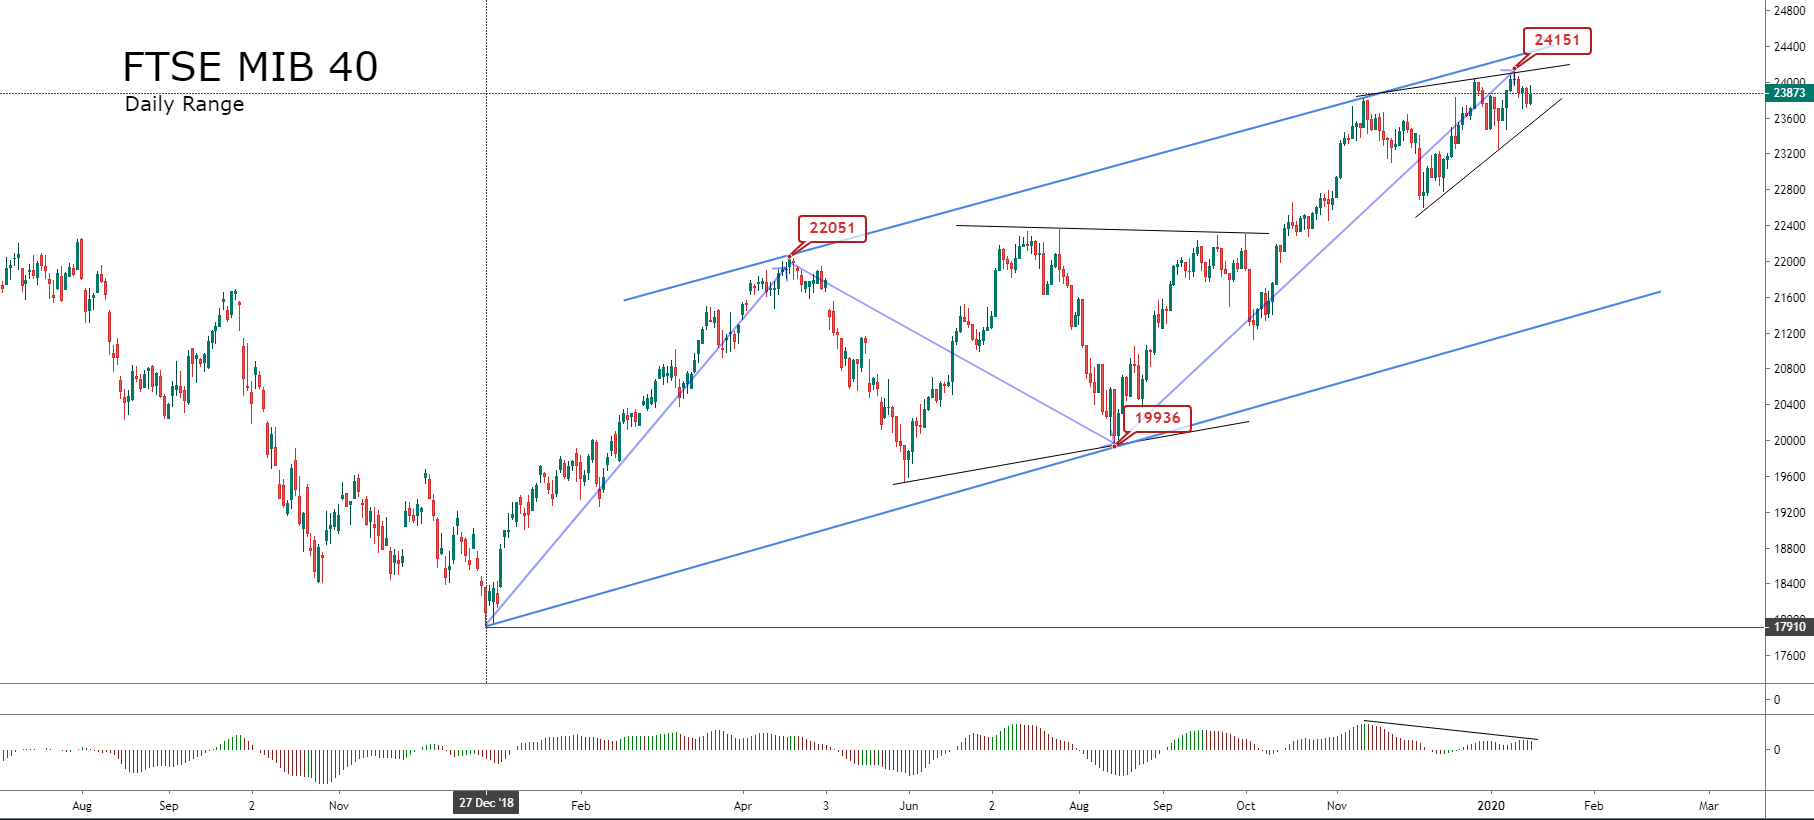
According to the Elliott wave theory, the ending diagonal pattern is a motive wave built with five overlapped segments that follow a 3-3-3-3-3 internal sequence.
The current bullish sequence began on the Christmas rally of 2018 at 17,910 points. The first bullish leg looks like a five-wave move that ended at 22,051 pts.
The second segment has the configuration of an irregular flat (3--3-5), which completed its structure at 19,936 points in mid-August 2019.
Once the second segment ended, the FTSE MIB 40 started a new five-wave sequence, which still is active and touched a high at 24,151 pts on January 10th, 2020.
In consequence, according to the long-term structure and its internal sequence subdivided by a 5-3-5 path, the Italian index advances in a zigzag pattern.
Following the sequence of an ending diagonal pattern, FTSE MIB 40 should develop a decline in three segments. Likely, this drop does not be below the 19,9366 pts. Once finished with this bearish leg, the Italian index should make a new bullish path that could surpass the 24,151 pts.
The following chart corresponds to the FTSE MIB in its 8-hour timeframe. The price action reveals that the bullish trend remains intact while the Italian index keeps above the 22,602 points.
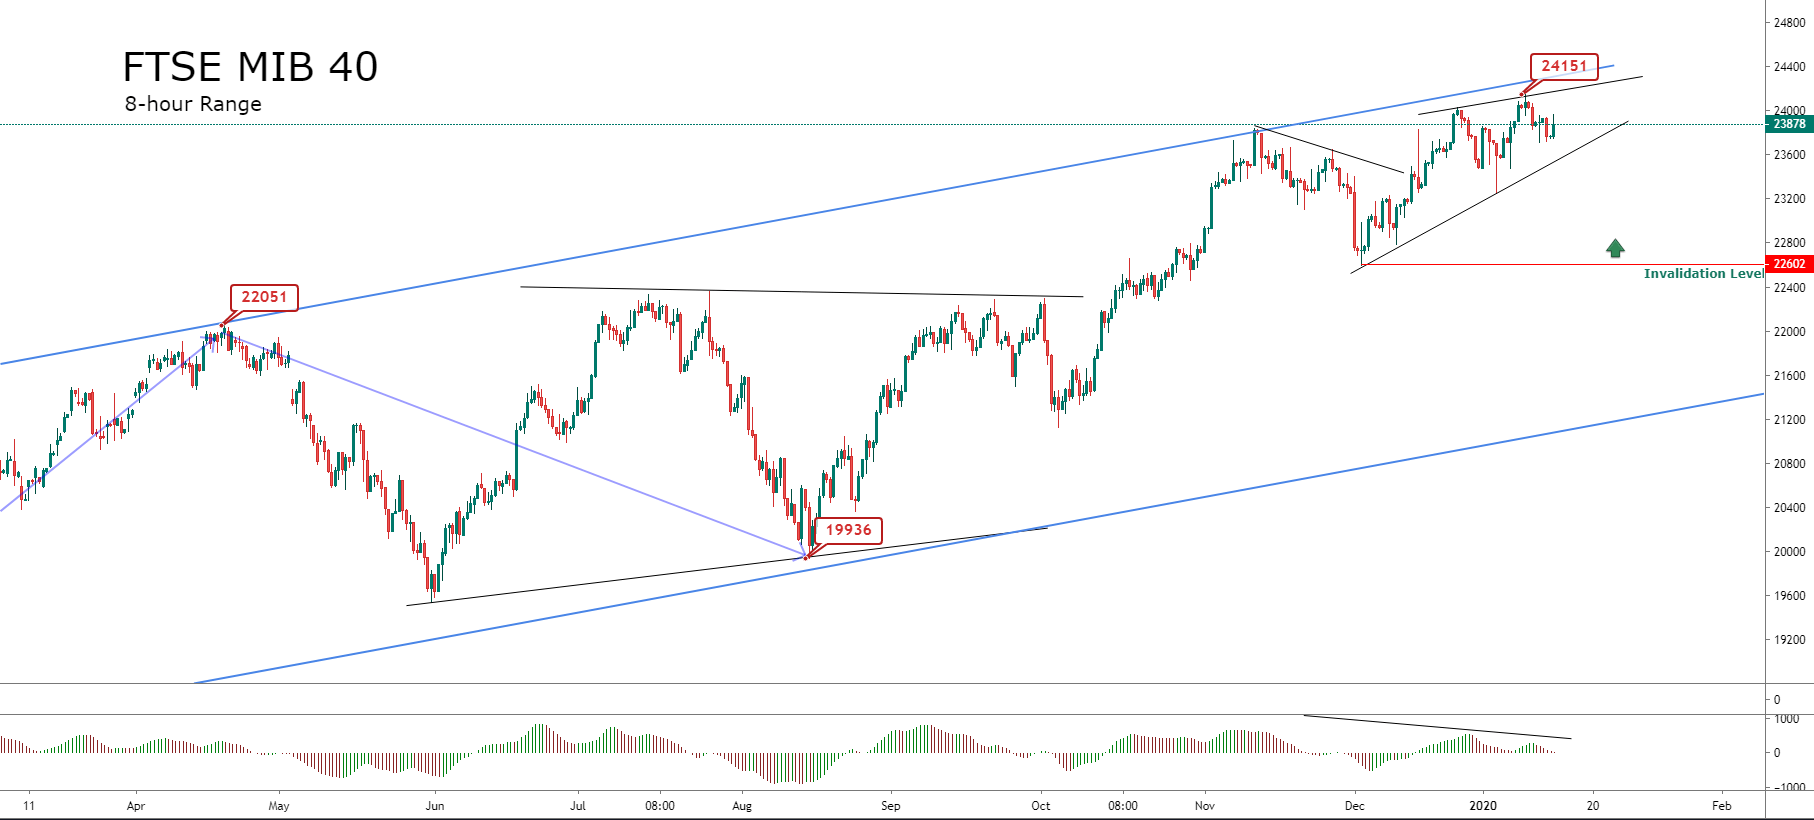
In conclusion, the Italian index FTSE MIB 40 currently runs in the fifth movement of a bullish five-wave sequence. This situation makes us maintain a neutral position, seeking a long-term positioning in the buy-side.
Risk Warning: CFD and Spot Forex trading both come with a high degree of risk. You must be prepared to sustain a total loss of any funds deposited with us, as well as any additional losses, charges, or other costs we incur in recovering any payment from you. Given the possibility of losing more than your entire investment, speculation in certain investments should only be conducted with risk capital funds that if lost will not significantly affect your personal or institution’s financial well-being. Before deciding to trade the products offered by us, you should carefully consider your objectives, financial situation, needs and level of experience. You should also be aware of all the risks associated with trading on margin.
Recommended Content
Editors’ Picks
EUR/USD edges lower toward 1.0700 post-US PCE

EUR/USD stays under modest bearish pressure but manages to hold above 1.0700 in the American session on Friday. The US Dollar (USD) gathers strength against its rivals after the stronger-than-forecast PCE inflation data, not allowing the pair to gain traction.
GBP/USD retreats to 1.2500 on renewed USD strength

GBP/USD lost its traction and turned negative on the day near 1.2500. Following the stronger-than-expected PCE inflation readings from the US, the USD stays resilient and makes it difficult for the pair to gather recovery momentum.
Gold struggles to hold above $2,350 following US inflation

Gold turned south and declined toward $2,340, erasing a large portion of its daily gains, as the USD benefited from PCE inflation data. The benchmark 10-year US yield, however, stays in negative territory and helps XAU/USD limit its losses.
Bitcoin Weekly Forecast: BTC’s next breakout could propel it to $80,000 Premium

Bitcoin’s recent price consolidation could be nearing its end as technical indicators and on-chain metrics suggest a potential upward breakout. However, this move would not be straightforward and could punish impatient investors.
Week ahead – Hawkish risk as Fed and NFP on tap, Eurozone data eyed too

Fed meets on Wednesday as US inflation stays elevated. Will Friday’s jobs report bring relief or more angst for the markets? Eurozone flash GDP and CPI numbers in focus for the Euro.