EUR/USD Forecast: Euro sellers retain control after PMI data
- EUR/USD stays under bearish pressure and trades below 1.0850.
- Disappointing PMI data from Germany and the Eurozone weigh on the Euro.
- The near-term technical outlook points to oversold conditions for the pair.

EUR/USD continues to push lower and trades below 1.0850 on in the European session on Wednesday after closing in negative territory on Tuesday. The near-term technical outlook points to oversold conditions as investors await PMI data from the US.
Euro PRICE This week
The table below shows the percentage change of Euro (EUR) against listed major currencies this week. Euro was the weakest against the Japanese Yen.
| USD | EUR | GBP | JPY | CAD | AUD | NZD | CHF | |
|---|---|---|---|---|---|---|---|---|
| USD | 0.49% | 0.27% | -1.67% | 0.55% | 1.37% | 1.51% | 0.18% | |
| EUR | -0.49% | -0.23% | -2.18% | 0.02% | 0.91% | 0.97% | -0.37% | |
| GBP | -0.27% | 0.23% | -2.05% | 0.24% | 1.14% | 1.19% | -0.15% | |
| JPY | 1.67% | 2.18% | 2.05% | 2.30% | 3.16% | 3.21% | 1.82% | |
| CAD | -0.55% | -0.02% | -0.24% | -2.30% | 0.90% | 0.97% | -0.38% | |
| AUD | -1.37% | -0.91% | -1.14% | -3.16% | -0.90% | 0.06% | -1.28% | |
| NZD | -1.51% | -0.97% | -1.19% | -3.21% | -0.97% | -0.06% | -1.30% | |
| CHF | -0.18% | 0.37% | 0.15% | -1.82% | 0.38% | 1.28% | 1.30% |
The heat map shows percentage changes of major currencies against each other. The base currency is picked from the left column, while the quote currency is picked from the top row. For example, if you pick the Euro from the left column and move along the horizontal line to the US Dollar, the percentage change displayed in the box will represent EUR (base)/USD (quote).
The souring market mood helped the US Dollar (USD) find demand on Tuesday and caused EUR/USD to stretch lower.
Early Wednesday, the data from Germany showed that the business activity in private sector contracted in July, with HCOB Composite PMI dropping to 48.7 from 50.4 in June. In the Eurozone, the Composite PMI declined to 50.1 from 50.9 in the same period.
Commenting on PMI surveys' findings, "beside the fact that we are talking about seasonally adjusted figures, looking at the two monitored sectors the situation deteriorated significantly in the manufacturing sector and counteracted moderate growth in the services sector," said Dr. Cyrus de la Rubia, Chief Economist at Hamburg Commercial Bank. "According to our GDP Nowcast, growth in the third quarter is still on the cards, however."
Later in the day, S&P Global will release Manufacturing and Services PMI data for the US. Both readings are forecast to hold comfortably above 50. In case any of the headline PMIs arrive below 50, the immediate reaction could weigh on the USD and help EUR/USD stage a rebound.
Meanwhile, US stock index futures trade deep in the red following mixed earnings results from Tesla and Alphabet (Google) that were released after the closing bell on Tuesday. In case safe-haven flows continue to dominate the action later in the day, EUR/USD could have a hard time gaining traction even if the US PMI data disappoint.
EUR/USD Technical Analysis
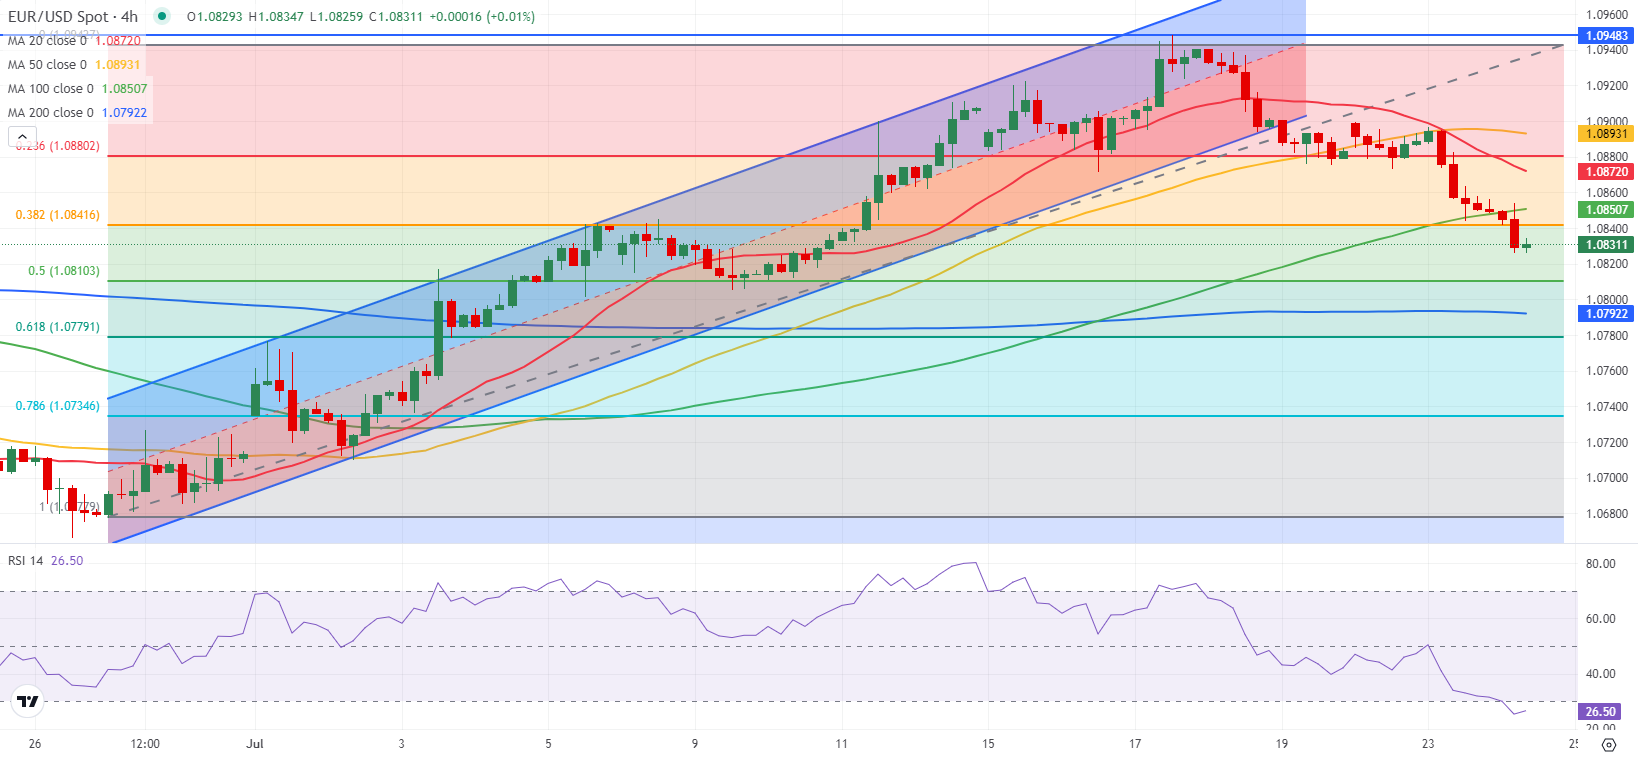
The Relative Strength Index (RSI) indicator on the 4-hour chart dropped below 30, reflecting oversold conditions in the near term. 1.0840-1.0850 (100-period Simple Moving Average (SMA), Fibonacci 38.2% retracement level of the latest uptrend) aligns as immediate resistance before 1.0880 (Fibonacci 23.6% retracement) and 1.0900 (psychological level, static level).
On the downside, supports align at 1.0810 (Fibonacci 50% retracement), 1.0790-1.0780 (200-period SMA, Fibonacci 61.8% retracement) and 1.0740 (Fibonacci 78.6% retracement).
Economic Indicator
S&P Global Composite PMI
The S&P Global Composite Purchasing Managers Index (PMI), released on a monthly basis, is a leading indicator gauging US private-business activity in the manufacturing and services sector. The data is derived from surveys to senior executives. Each response is weighted according to the size of the company and its contribution to total manufacturing or services output accounted for by the sub-sector to which that company belongs. Survey responses reflect the change, if any, in the current month compared to the previous month and can anticipate changing trends in official data series such as Gross Domestic Product (GDP), industrial production, employment and inflation. The index varies between 0 and 100, with levels of 50.0 signaling no change over the previous month. A reading above 50 indicates that the private economy is generally expanding, a bullish sign for the US Dollar (USD). Meanwhile, a reading below 50 signals that activity is generally declining, which is seen as bearish for USD.
Read more.Next release: Wed Jul 24, 2024 13:45 (Prel)
Frequency: Monthly
Consensus: -
Previous: 54.8
Source: S&P Global
Premium
You have reached your limit of 3 free articles for this month.
Start your subscription and get access to all our original articles.
Author

Eren Sengezer
FXStreet
As an economist at heart, Eren Sengezer specializes in the assessment of the short-term and long-term impacts of macroeconomic data, central bank policies and political developments on financial assets.


