EUR/USD Forecast: Euro looks to end the week on a bullish note
- EUR/USD trades at fresh two-week high near 1.0750.
- Improving risk mood could help the pair stretch higher ahead of the weekend.
- The US economic docket will feature PCE inflation data for March.

EUR/USD preserves its bullish momentum after closing in positive territory on Thursday and trades at its highest level since April 11 at around 1.0750. Although the near-term technical outlook points to overbought conditions, the improving risk mood could help the pair continue to push higher ahead of the weekend.
The US Dollar (USD) came under bearish pressure after the US Bureau of Economic Analysis (BEA) reported that the real Gross Domestic Product (GDP) expanded at an annual rate of 1.6% in the first quarter, much weaker than the market expectation of 2.5%. The details of the report, however, showed that the GDP Price Index, also known as the price deflator, climbed to 3.1% in the same period from 1.7%, helping the USD limit its losses.
Early Friday, US stock index futures trade decisively higher. In case risk flows continue to dominate the financial markets in the American session, the USD could have a hard time finding demand.
The BEA will publish the Personal Consumption Expenditures (PCE) Price Index data for March later in the day. The GDP report on Thursday showed that the PCE Price Index rose 3.4% on a quarterly basis in the first quarter, compared to the 1.8% increase recorded in the last quarter of 2023. Since the quarterly figures are already unveiled, investors are likely to show little to no reaction to the monthly PCE inflation data.
EUR/USD Technical Analysis
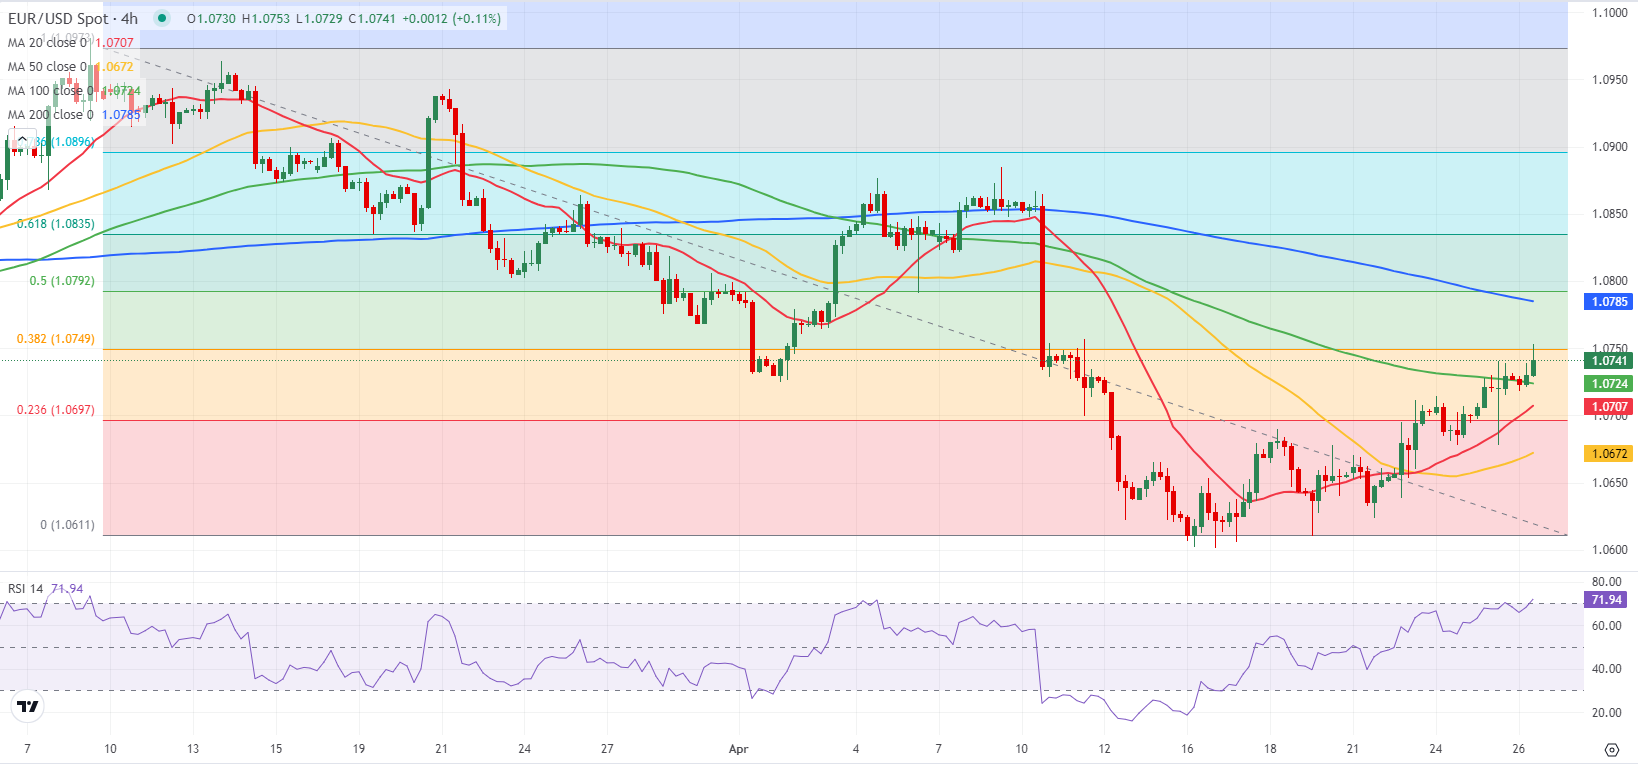
The Relative Strength Index (RSI) indicator on the 4-hour chart stays above 70 early Friday, reflecting overbought conditions in the short term.
1.0750 (Fibonacci 38.2% retracement of the latest downtrend) aligns as immediate resistance for EUR/USD. Once the pair stabilizes above that level, 1.0780-1.0790 (200-period Simple Moving Average (SMA) on the 4-hour chart, Fibonacci 50% retracement) could be seen as next resistance before 1.0835 (Fibonacci 61.8% retracement).
On the downside, supports are located at 1.0700 (Fibonacci 23.6% retracement), 1.0670 (50-period SMA) and 1.0650 (static level).
Premium
You have reached your limit of 3 free articles for this month.
Start your subscription and get access to all our original articles.
Author

Eren Sengezer
FXStreet
As an economist at heart, Eren Sengezer specializes in the assessment of the short-term and long-term impacts of macroeconomic data, central bank policies and political developments on financial assets.


