EUR/JPY: Finding trends and setting support levels

Finding trend line
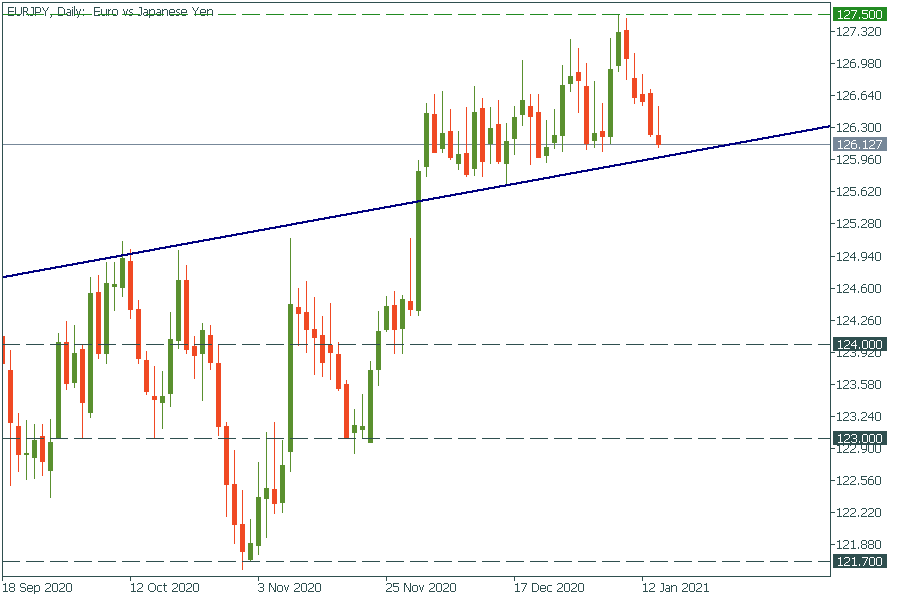
First, the trend line. How to draw trend lines is one of the most frequently asked questions. On the chart below it should be visibly obvious how to do that. See if you can find a sequence of highs or lows that seems to follow the same line – and draw that line. Here, we have such a sequence: all that comes after December 1 is well lined-up in a straight upward trajectory.
There is more: although it didn’t fit into the chart, but the side on the left – that comes before August 21 – also follows the same trend. How to explain that: possibly, assuming that the September-November set back was just a temporary correction of a larger upward trend. In any case, there is no denying that the ascending trajectory on the left and the same on the right follow exactly the same uptrend. That is why we have it over there.
How to use it? Extend the trend into the future. When does it supposedly come to, say, 127.50? In two-three months. Now, that’s your basis for long-term planning. It may be there earlier, or, it may fall behind that trajectory, but at least for position trading you already have a plan: the resistance of 127.50 to be reached in April.
Finding support levels
What else do we have here? Several layers of support. 124.00, 123,00, and 121,80. The first two are probably even more valid as these are round levels. So, here is another F. A. Q.: “How to draw support and resistance levels”? Here you go: observe the stairs-like nature of the dropdown and its resolution that happened in September-November. During these months, the price doesn’t seem to have stopped at other levels but these three. This is your guide to find supports: if the price touched the same bottom several times, this is your support level. 123.00 is the most frequently visited line here. It was slightly broken in September, touched in October, and made the price reverse in November.
What use do you make of this one? For future references and preparations. If you see that the long-term picture point to the downside – you’ll know that 123.00 may be one of the key targets for the price. IF and when it comes down there, it will be having the strongest potential to send the price back up as it did already several times.
So, that was your practical briefing on how to set trend lines and support levels. Thank EUR/JPY.
Author

FBS Team
FBS
FBS team is a group of professional analysts focused on Forex, stock, and commodity markets. Each expert possesses a years-long experience in fundamental and technical analysis.


