|

EUR/JPY double top forming at 144.24 weekly resistance level?

Overview

A complete top down analysis of the EURJPY.
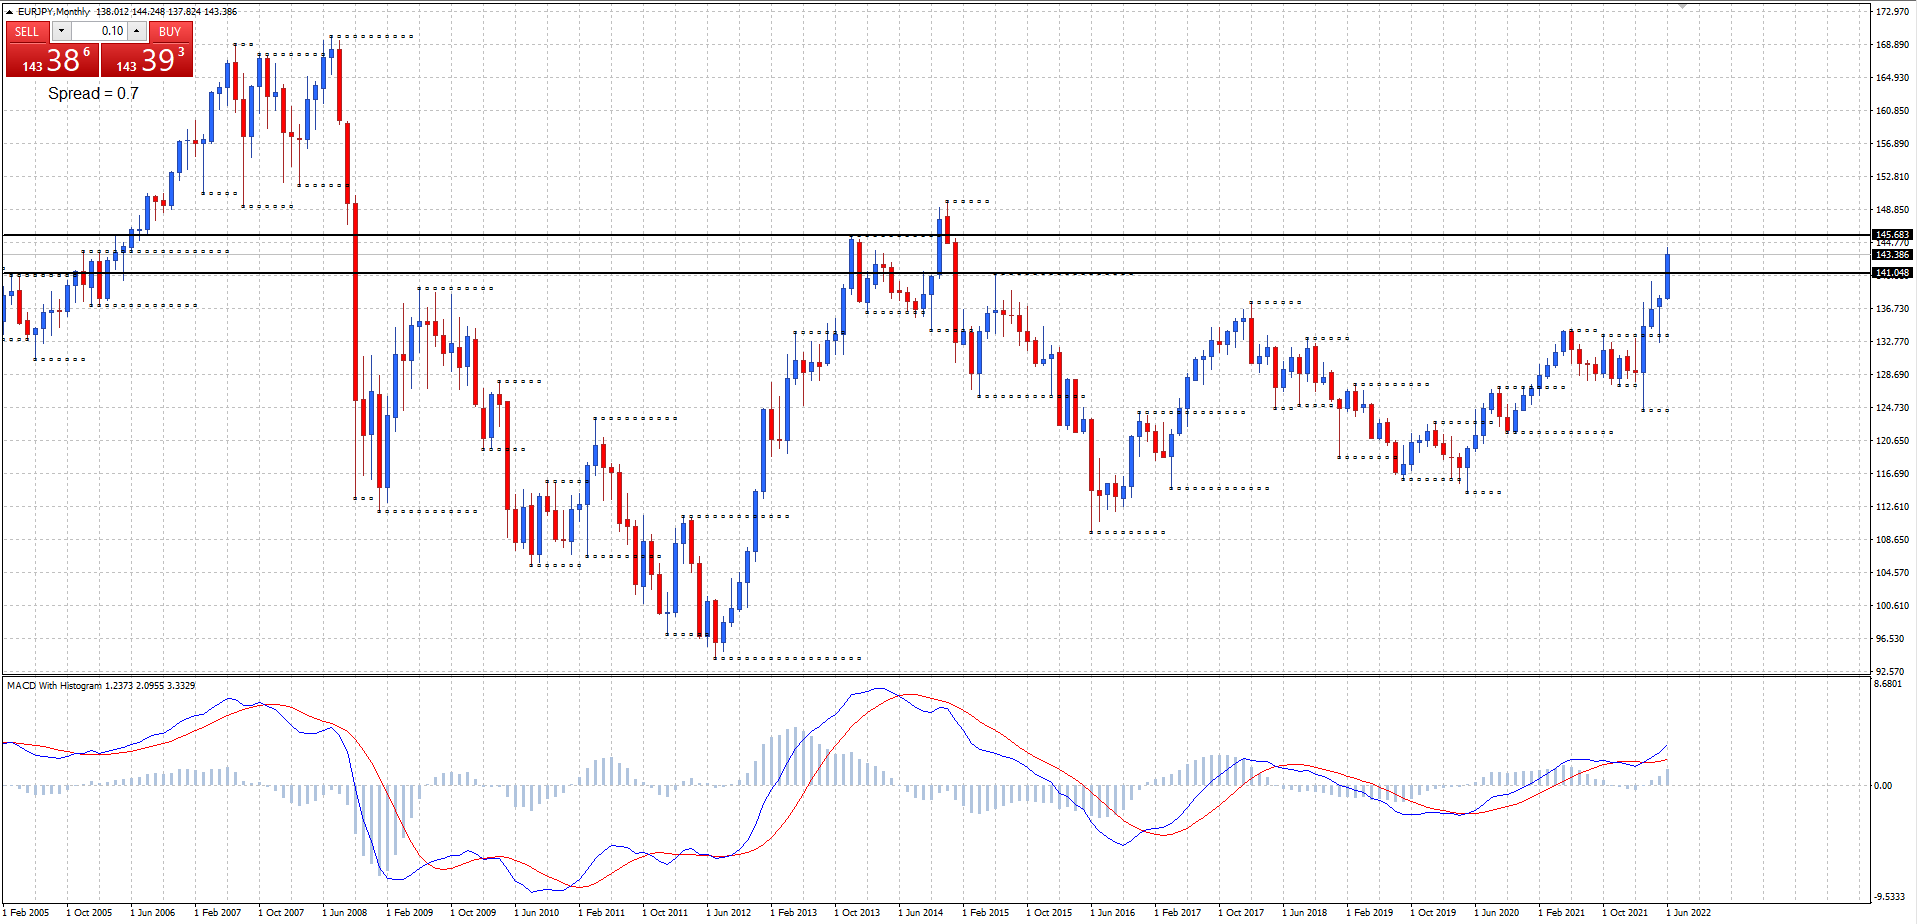
EUR/JPY monthly

Monthly support at 141.04, resistance at 145.68.

Monthly chart is in an uptrend holding above the 141.04 monthly support level.
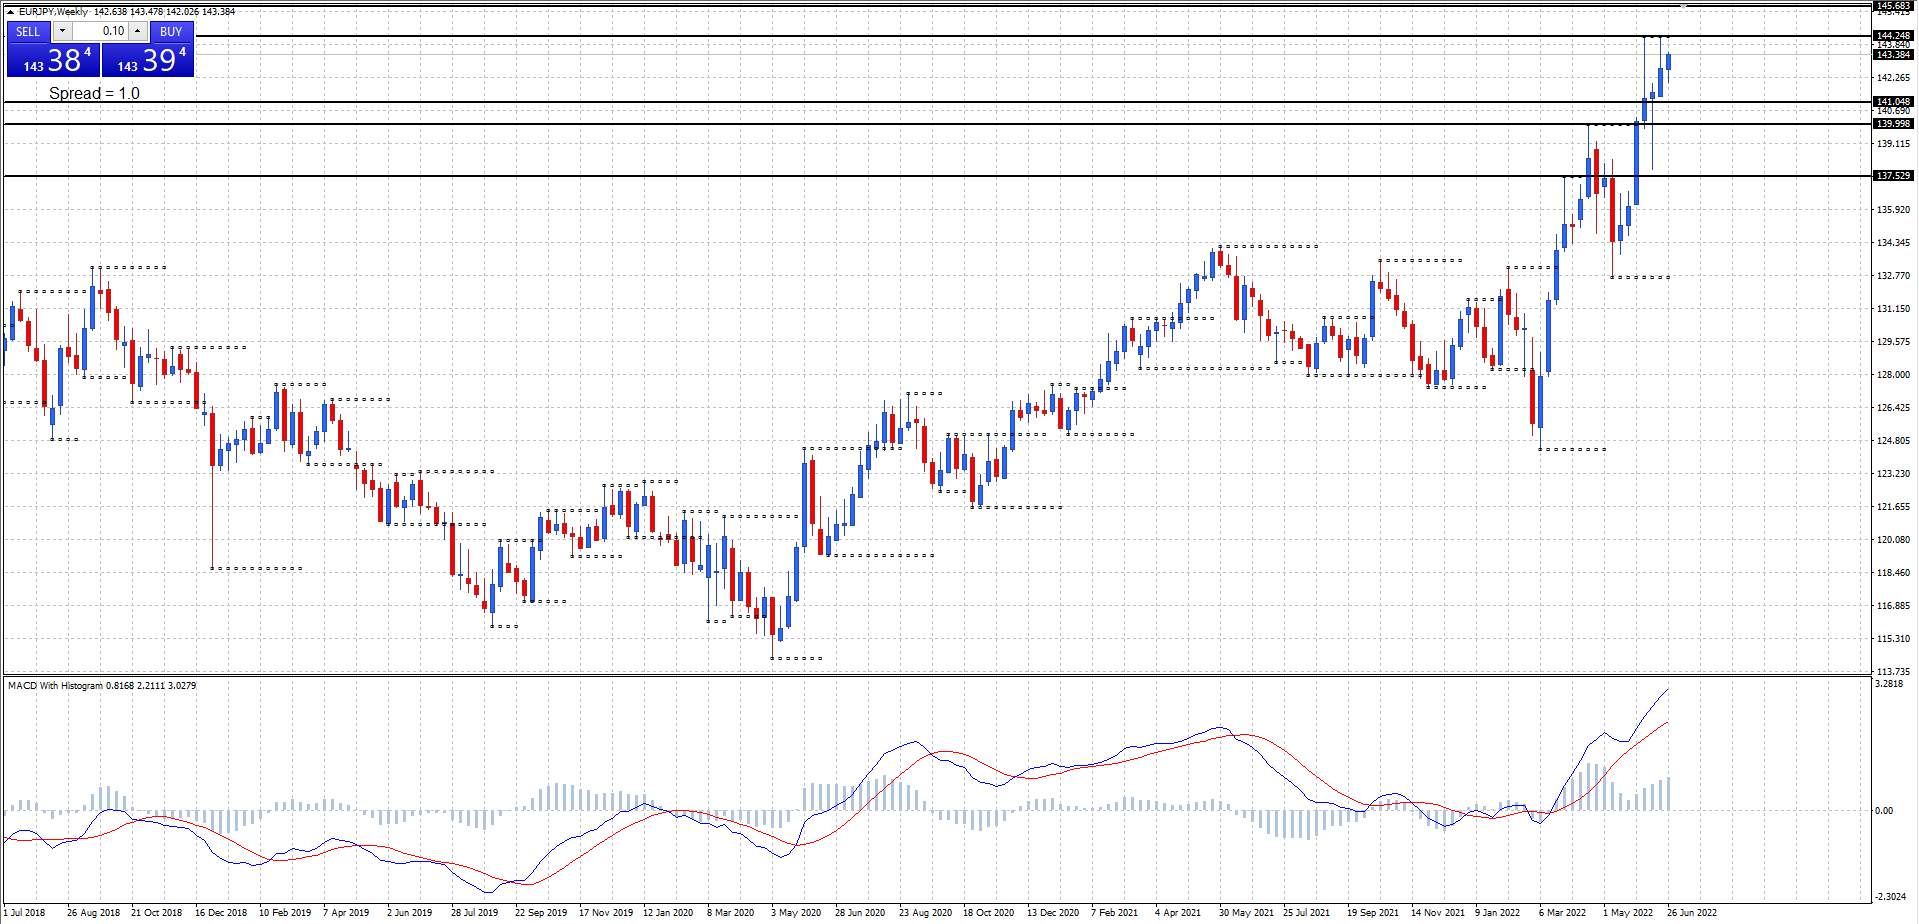
EUR/JPY weekly

Weekly support at 139.99 and 137.52, resistance at 144.24.

Weekly chart is in an uptrend, but price has been rejecting the 144.24 weekly resistance level. Will price hold or move above the 144.24 weekly resistance level?

EUR/JPY daily

Daily support at 141.39, resistance at 144.24.

A double top pattern may be forming at the 144.24 weekly resistance level. A break below 142.02 yesterday’s low would start to confirm the formation of a lower top following the double top pattern on the daily chart.

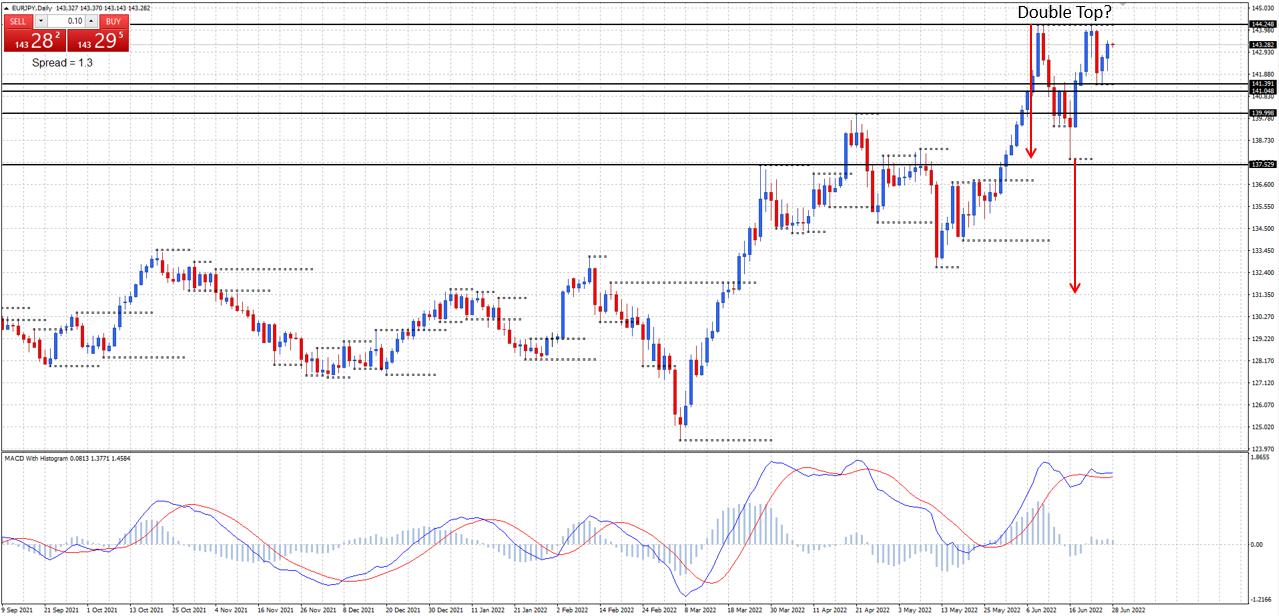
Short term target 141.04 monthly support. Medium term target 137.82 daily support. Double top price projection target 131.40.

Author

Duncan Cooper

Duncan Cooper

ACY Securities

Duncan Cooper is a full-time trader and mentor. He has been actively trading the financial markets for more than 15 years and has traded stocks, options, futures, and the Forex Market since 2005.

More from Duncan Cooper
Share:

Editor's Picks

EUR/USD tests nine-day EMA support near 1.1850

EUR/USD remains in the negative territory for the fourth successive session, trading around 1.1870 during the Asian hours on Friday. The 14-day Relative Strength Index momentum indicator at 56 stays above the midline, confirming steady momentum. RSI has eased but remains above 50, indicating momentum remains constructive for the bulls.

GBP/USD consolidates around 1.3600 vs. USD; looks to US CPI for fresh impetus

The GBP/USD pair remains on the defensive through the Asian session on Friday, though it lacks bearish conviction and holds above the 1.3600 mark as traders await the release of the US consumer inflation figures before placing directional bets.

Gold recovers swiftly from weekly low, climbs back closer to $5,000 ahead of US CPI

Gold regains positive traction during the Asian session on Friday and recovers a part of the previous day's heavy losses to the $4,878-4,877 region, or the weekly low. The commodity has now moved back closer to the $5,000 psychological mark as traders keenly await the release of the US consumer inflation figures for more cues about the Federal Reserve's policy path.

Solana: Mixed market sentiment caps recovery

Solana is trading at $79 as of Friday, following a correction of over 9% so far this week. On-chain and derivatives data indicates mixed sentiment among traders, further limiting the chances of a price recovery.

A tale of two labour markets: Headline strength masks underlying weakness

Undoubtedly, yesterday’s delayed US January jobs report delivered a strong headline – one that surpassed most estimates. However, optimism quickly faded amid sobering benchmark revisions.

Solana Price Forecast: Mixed market sentiment caps recovery

Solana (SOL) is trading at $79 as of Friday, following a correction of over 9% so far this week. On-chain and derivatives data indicates mixed sentiment among traders, further limiting the chances of a price recovery.