DXY turns from one-year peaks, GBP/USD eyeing whipsaw above $1.35

EUR/USD:
(Italics: previous analysis)
Weekly timeframe:
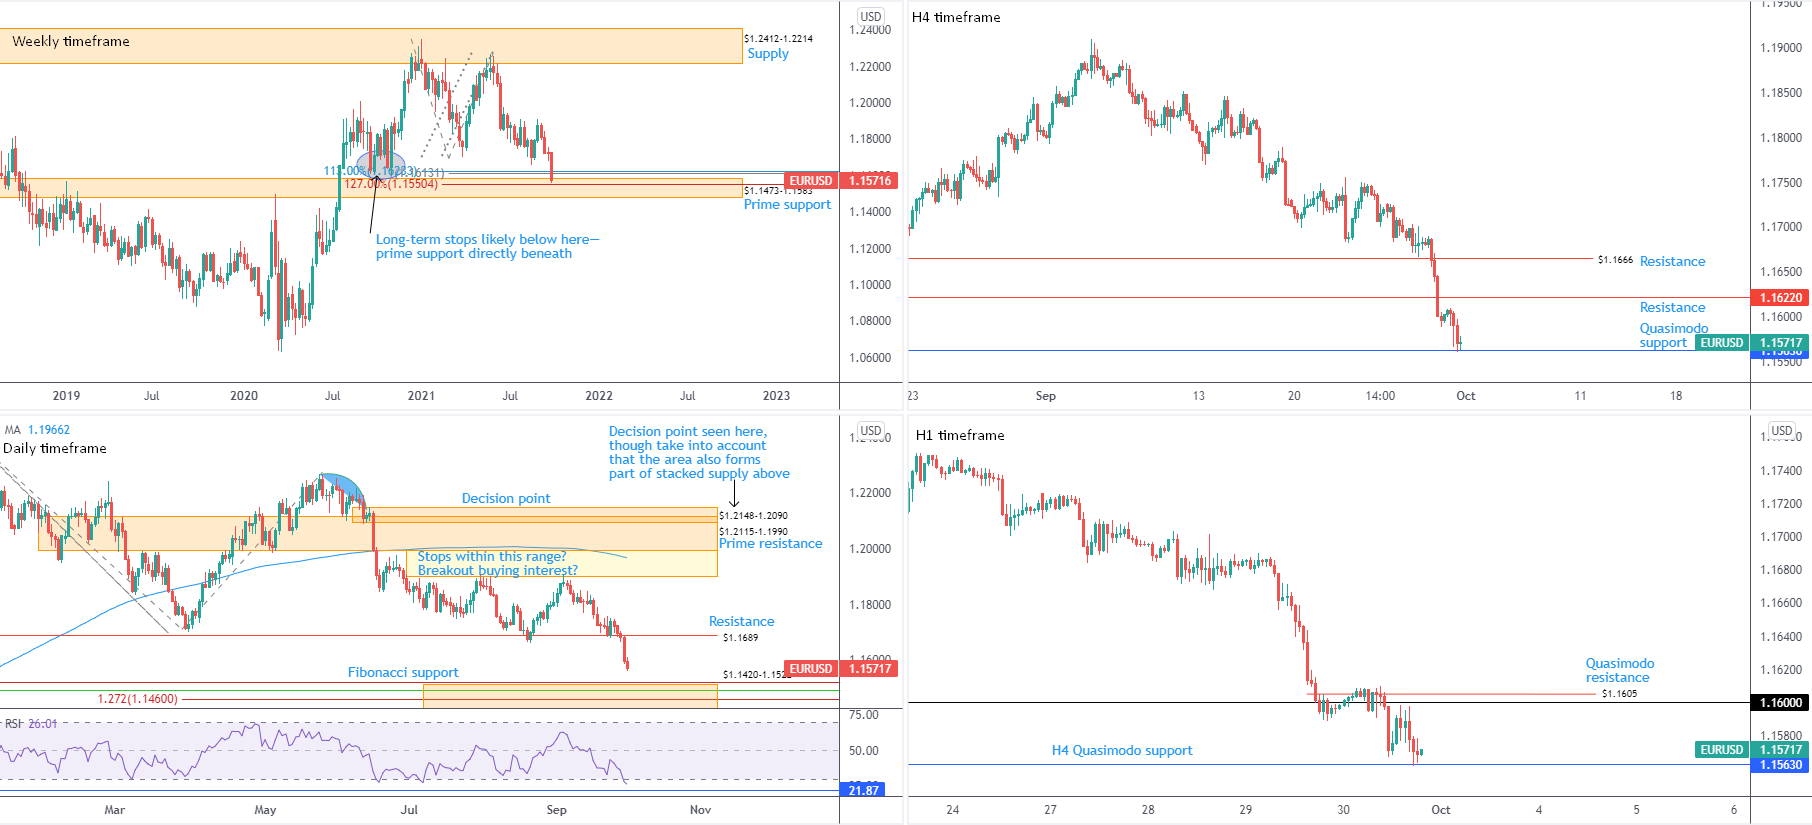
EUR/USD—down 1.2 percent on the week—shook hands with prime support at $1.1473-1.1583, a long-term base sharing chart space with a 100% Fibonacci projection at $1.1613 and a 1.27% Fibonacci extension at $1.1550. Note the 100% value represents a harmonic AB=CD bullish point, bringing a 1.13% BC Fibonacci extension to the table at $1.1623.
Also technically interesting on the weekly scale is the possibility of long-term sell-stops residing south of late September lows at $1.1612 (2020). Sell-stops could fuel larger buyer interest from $1.1473-1.1583.
Trend studies show that with the break of $1.1612 lows, the pair is perhaps in the early phase of a trend change to the downside.
Daily timeframe:
Europe’s shared currency extended losses against its US counterpart Thursday, as the US dollar index—benchmark for gauging dollar value versus six foreign currencies—clocked fresh one-year tops at 94.50. Thursday’s mild bout of selling follows Wednesday’s one-sided EUR/USD decline amidst USD support on the back of rising US Treasury yields.
Of technical note is Quasimodo support at $1.1689 stepping aside and Fibonacci support between $1.1420 and $1.1522 (glued to the lower side of the weekly timeframe’s prime support at $1.1473-1.1583) marching into the frame as a reasonable downside objective.
Momentum, according to the relative strength index (RSI), also arrived at oversold terrain, eyeing support at 21.87. Note that in light of the currency pair grinding lower since June, the RSI may remain within oversold space for a lengthy period.
H4 timeframe:
Recent hours witnessed a test of Quasimodo support unfold—a level drawn from the beginning of November 2020 at $1.1563. Any upside attempt from the latter has yesterday’s high at $1.1610 in sight and resistance at $1.1622 (previous Quasimodo support).
Space south of $1.1563 guides the technical spotlight towards possible support taken from 9th March high $1.1495 (2020).
With immediate flow facing lower, $1.1563 is vulnerable. With this, either a test of $1.1622 or a decisive breakout below $1.1563 could fuel further bearish interest.
H1 timeframe:
A closer reading of price action on the H1 chart reveals the H4 timeframe’s Quasimodo support at $1.1563 can be drawn on the H1 scale.
Overthrowing $1.1563 highlights Quasimodo support from 21st July at $1.1520, whereas efforts to climb from $1.1563 might establish a pullback to $1.16 and neighbouring Quasimodo resistance at $1.1605.
Though, as was noted on the H4 timeframe, downside risks are clear in terms of current trend direction.
Observed Technical Levels:
Understanding the daily timeframe exhibits scope to press for Fibonacci support between $1.1420 and $1.1522 may weigh on buying out of weekly prime support at $1.1473-1.1583. A drop beneath the H4 timeframe’s Quasimodo support at $1.1563, therefore, underlines a bearish scenario in the direction of H1 Quasimodo support at $1.1520, arranged alongside the upper edge of daily Fibonacci support ($1.1522).
AUD/USD:
(Italics: previous analysis)
Weekly timeframe:
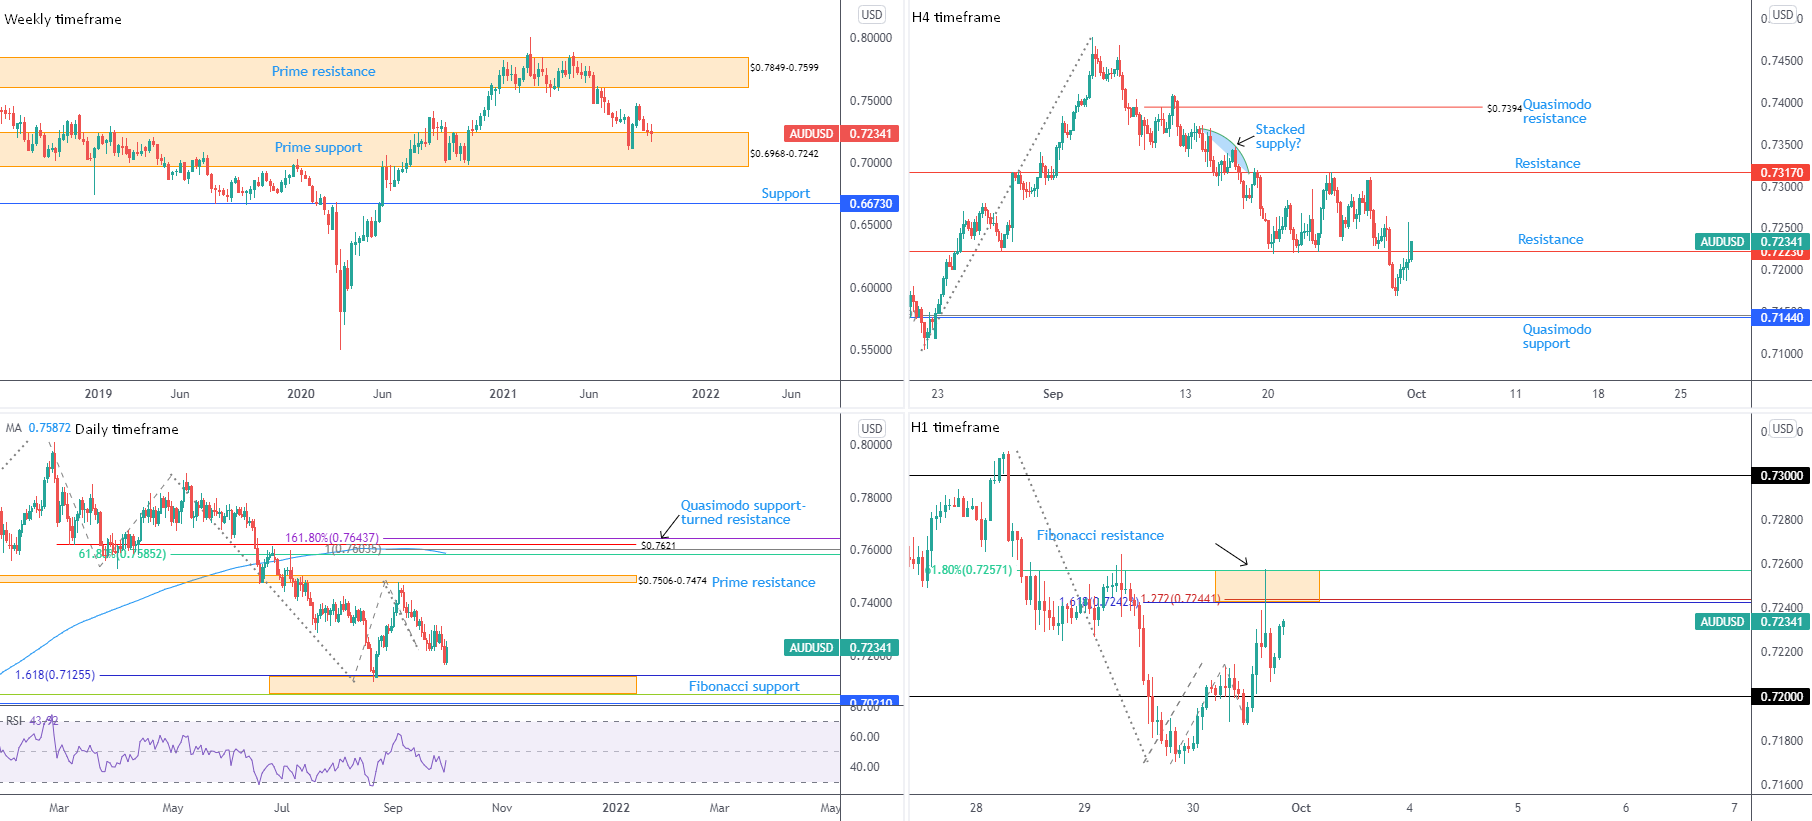
According to the weekly chart, buyers and sellers remain battling for position around the upper perimeter of prime support at $0.6968-0.7242. Current price movement emphasises a bearish tone, perhaps setting the stage for a deeper move within the said support over the coming weeks.
Buyers regaining consciousness have prime resistance at $0.7849-0.7599 to target. Failure to command position from $0.6968-0.7242, on the other hand, opens up support at $0.6673.
Trend studies on the weekly scale show we’ve been higher since early 2020. Consequently, any response from $0.6968-0.7242 might be the start of a dip-buying attempt to join the current trend.
Daily timeframe:
Latest from the daily chart has candle action on the doorstep of Fibonacci support between $0.7057 and $0.7126, fixed just north of support at $0.7021.
$0.7057-0.7126, knowing the zone capped selling in August, could help boost bullish interest from within the weekly timeframe’s prime support at $0.6968-0.7242.
Momentum continues to explore area beneath the 50.00 centreline, according to the relative strength index (RSI). The indicator value maintaining position below 50.00 signals downside momentum: average losses exceeding average gains.
H4 timeframe:
Resistance at $0.7223 made its way into view on Thursday. Technicians will note this is a barrier that served well as support late August through late September. Yet, the initial $0.7223 response has failed to draw bearish attention, potentially unlocking the door to additional upside to resistance at $0.7371.
In the event that sellers put in an appearance, Quasimodo support from 0.7144 and a deep 88.6% Fibonacci retracement at $0.7146 is visible.
H1 timeframe:
Thursday had price movement test Fibonacci resistance made up between a 61.8% Fibonacci retracement at $0.7257, a 1.618% Fibonacci expansion at $0.7242 and a 1.272% Fibonacci projection at $0.7244. Though, as you can see, price was unable to test $0.72 as the market sentiment displayed a mild improvement into the close, alongside a USD decline (DXY off one-year highs at 94.50).
Movement north of $0.7257-0.7242 has $0.73 to target.
Observed Technical Levels:
Buyers appear to be gaining strength on the H4 timeframe above resistance at $0.7223, which could lead the unit to H4 resistance at $0.7317 and, by extension, the $0.73 figure on the H1 scale.
USD/JPY:
(Italics: previous analysis)
Weekly timeframe:
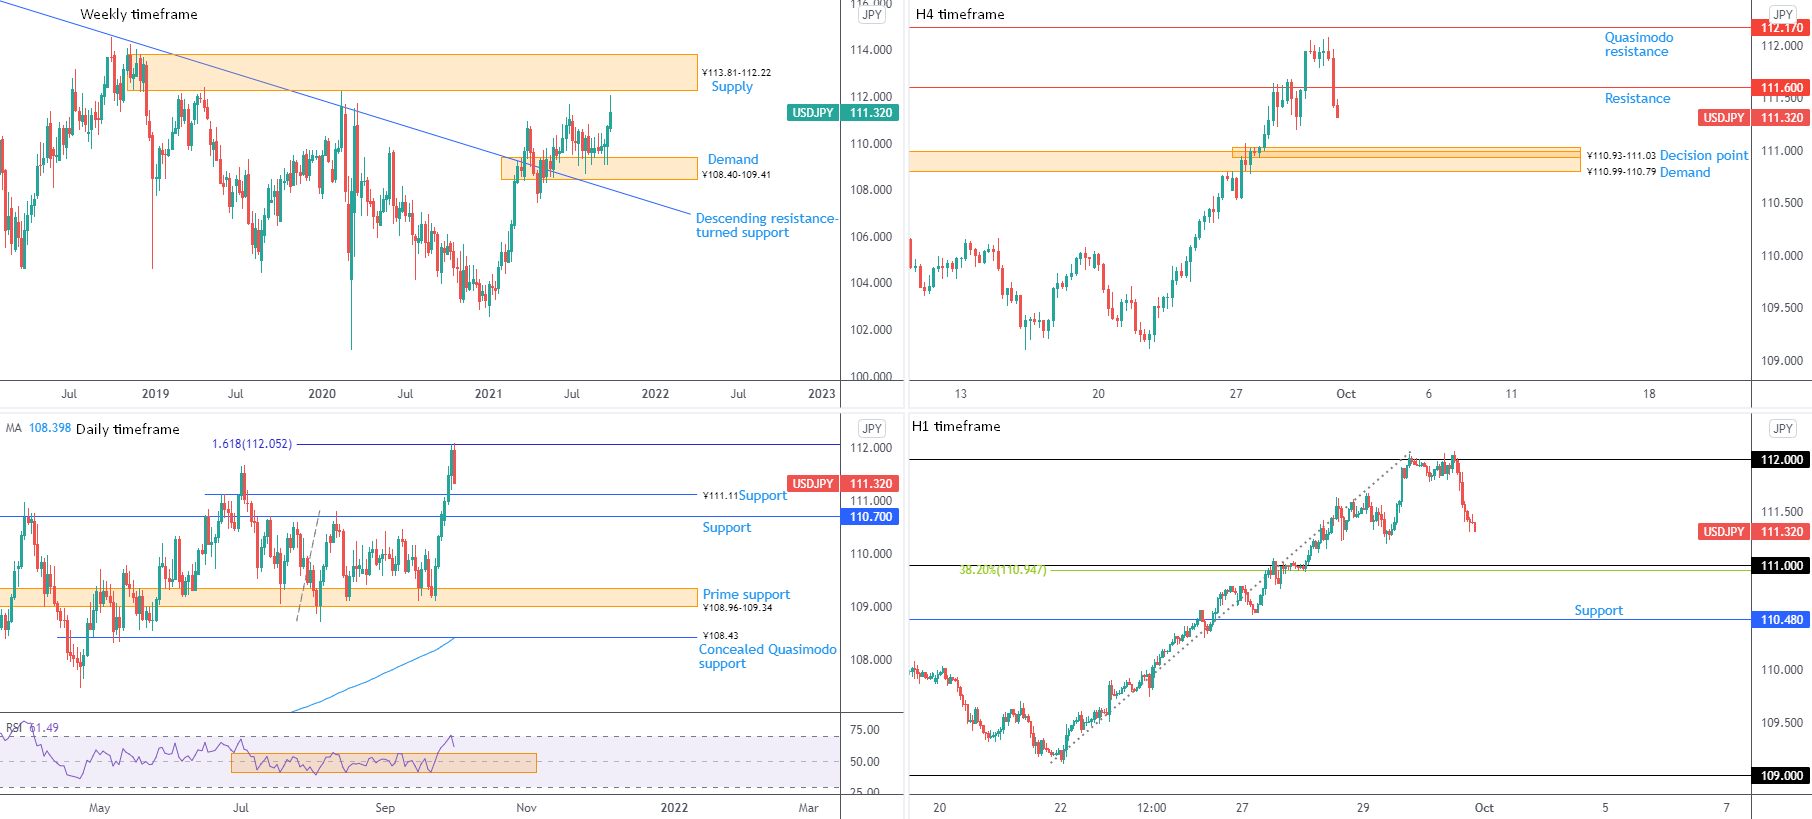
USD/JPY came within close range of testing supply at ¥113.81-112.22 in recent days, following a robust recovery from ¥108.40-109.41 demand.
Daily timeframe:
Recording 19-month highs at ¥112.08 observed Thursday cross swords with a 1.618% Fibonacci expansion at ¥112.05 and hold. Bearish interest snapped a six-day advance and subsequently seated price ahead of support at ¥111.11, a previous Quasimodo resistance level, and nearby support coming in at ¥110.70.
Technicians who track the relative strength index (RSI) to estimate momentum will note the indicator’s value tested overbought as price brought in ¥112.05 Fibonacci resistance.
H4 timeframe:
Leaving an aged Quasimodo resistance at ¥112.17 (a level drawn from April 2019) unchallenged on Thursday, we are now back below resistance at ¥111.60 and at the doorway of Wednesday’s low from ¥111.21. Snapping beneath the latter draws in supply-turned demand at ¥110.99-110.79 and a decision point at ¥110.93-111.03.
H1 timeframe:
Broad dollar strength losing steam yesterday saw the currency pair drop sharply from the ¥112 figure, with eyes now likely on ¥111, closely shadowed by a 38.2% Fibonacci retracement at ¥110.95. Note that ¥111 shares space with daily support at ¥111.11 and the upper perimeter of the H4 decision point at ¥111.03.
Observed Technical Levels:
All eyes are on ¥111. As highlighted above, the big figure also brings daily and H4 support to the table, alongside a 38.2% Fibonacci retracement. Consequently, a dip-buying attempt may unfold from ¥111 if tested today.
GBP/USD:
(Italics: previous analysis)
Weekly timeframe:
Sterling remains on the back foot, down 1.4 percent on the week.
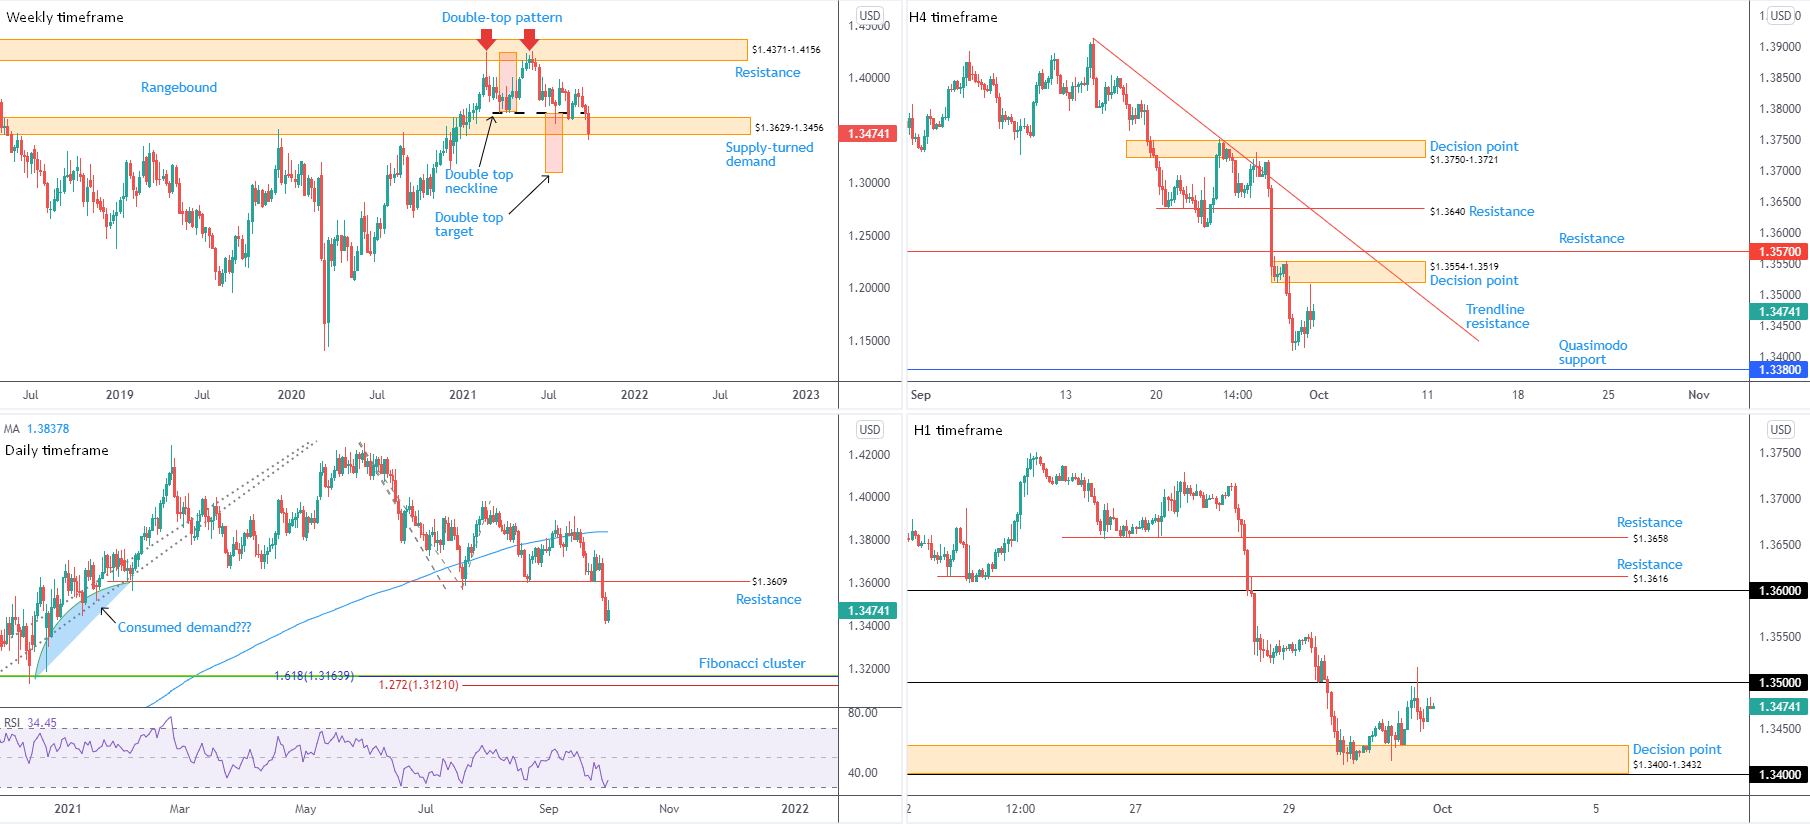
Supply-turned demand at $1.3629-1.3456 had its lower edge breached yesterday, action confirming bearish intent following the close below a double-top pattern’s ($1.4241) neckline at $1.3669. The double-top pattern’s profit objective—measured by taking the distance between the highest peak to the neckline and extending this value lower from the neckline—sits around $1.3093.
Conservative pattern sellers are likely to pursue a candle close beneath $1.3629-1.3456 before pulling the trigger.
Daily timeframe:
Interestingly, the daily chart reveals that after clearing Quasimodo support at $1.3609 (now labelled resistance), room to scale lower to a Fibonacci cluster between $1.3121 and $1.3167 is in view.
Nevertheless, with respect to the relative strength index (RSI) we recently came into contact with oversold territory and formed a mild recovery. If the value manages to hold above 30.00 and works its way above the 50.00 centreline, retesting price resistance at $1.3609 is possible.
H4 timeframe:
As evident from the H4 scale, cable spiked higher on Thursday and missed the decision point at $1.3554-1.3519 by a whisker before turning lower. Note this area resides a few pips beneath resistance at $1.3570 and trendline resistance, etched from the high $1.3913.
Technical interest to the downside draws us to Quasimodo support at $1.3380.
H1 timeframe:
The decision point at $1.3400-1.3432 (set on top of the $1.34 figure) made an entrance on Wednesday and has, as you can see, welcomed buyers to bring in $1.35. Upstream from here we have local highs at $1.3555, though $1.36 is likely to garner more attention as it converges closely with resistance at $1.3616 (a prior Quasimodo support).
Attempts to dethrone $1.3400-1.3432 throws light on the H4 timeframe’s Quasimodo support level at $1.3380. In fact, this level is strategically positioned to help facilitate a stop-run south of $1.34.
Observed Technical Levels:
Recognising we have room to pursue lower levels on the daily timeframe until hitting a Fibonacci cluster between $1.3121 and $1.3167, on top of the weekly timeframe slicing through the lower edge of supply-turned demand at $1.3629-1.3456, a whipsaw above $1.35 into the H4 timeframe’s decision point at $1.3554-1.3519 could materialise before sellers attempt another push lower.
Alternatively, a whipsaw through the H1 decision point at $1.3400-1.3432 into H4 Quasimodo support at $1.3380 could come about. Still, any upside derived from this move may be restricted due to the location this market is in on the bigger picture (see above).
Author

Aaron Hill
FP Markets
After completing his Bachelor’s degree in English and Creative Writing in the UK, and subsequently spending a handful of years teaching English as a foreign language teacher around Asia, Aaron was introduced to financial trading,


