Dow down again
USD: Jun '24 is Up at 105.530.
Energies: Jul '24 Crude is Up at 78.41.
Financials: The Sept '24 30 Year T-Bond is Up 20 ticks and trading at 120.15.
Indices: The Jun '24 S&P 500 emini ES contract is 130 ticks Lower and trading at 5405.25.
Gold: The Jun'24 Gold contract is trading Up at 2343.40
Initial conclusion
This is not a correlated market. The USD is Up and Crude is Up which is not normal, and the 30 Year T-Bond is trading Up. The Financials should always correlate with the US dollar such that if the dollar is Higher, then the bonds should follow and vice-versa. The S&P is Lower and Crude is trading Higher which is correlated. Gold is trading Higher which is not correlated with the US dollar trading Up. I tend to believe that Gold has an inverse relationship with the US Dollar as when the US Dollar is down, Gold tends to rise in value and vice-versa. Think of it as a seesaw, when one is up the other should be down. I point this out to you to make you aware that when we don't have a correlated market, it means something is wrong. As traders you need to be aware of this and proceed with your eyes wide open. Asia is trading Mixed with half the exchanges trading Higher and the other half Lower. Currently all of Europe is trading Lower.
Possible challenges to traders
-
Import Prices m/m is out at 8:30 AM EST. This is Major.
-
Prelim UoM Consumer Sentiment is out at 10 AM EST. This is Major.
-
Prelim UoM Inflation Expectations is out at 10 AM EST. This is Major.
Traders, please note that we've changed the Bond instrument from the 10 year (ZN) to the 2 year (ZT). They work exactly the same.
We've elected to switch gears a bit and show correlation between the 10-year Treasury notes (ZN) and the S&P futures contract. The YM contract is the Dow Jones Industrial Average, and the purpose is to show reverse correlation between the two instruments. Remember it's likened to a seesaw, when up goes up the other should go down and vice versa.
Yesterday the ZT migrated Higher at around 8:30 AM EST after the PPI data was reported. If you look at the charts below the ZT gave a signal at around 8:30 AM and started its Upward climb. Look at the charts below and you'll see a pattern for both assets. The Dow moved Lower at around 8:30 AM and the ZT moved Higher at around the same time. These charts represent the newest version of BarCharts and I've changed the timeframe to a 15-minute chart to display better. This represented a Long opportunity on the 2-year note, as a trader you could have netted 30 plus ticks per contract on this trade. Each tick is worth $7.625. Please note: the front month for ZT is Sept and the S&P is still Jun '24. I've changed the format to filled Candlesticks (not hollow) such that it may be more apparent and visible.
Charts courtesy of barcharts
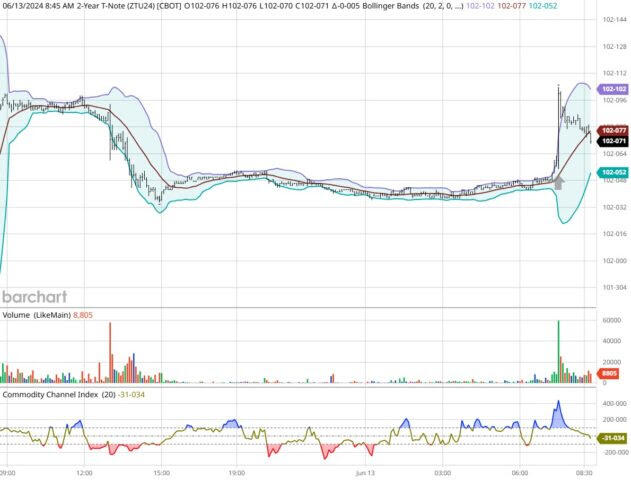
ZT -Sept 2024 - 06/13/24
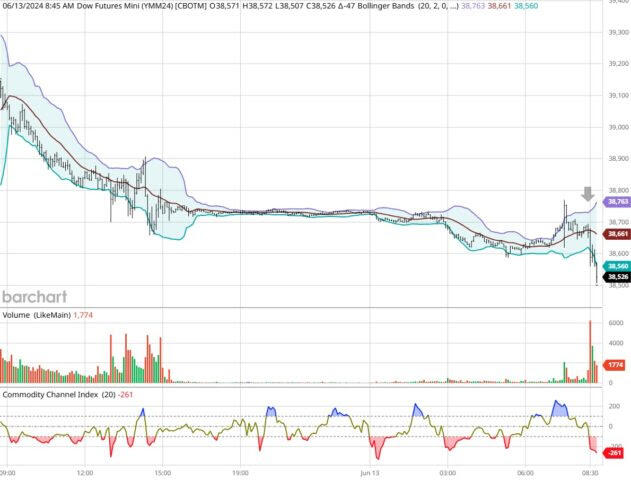
Dow - Jun 2024 - 06/13/24
Bias
Yesterday we gave the markets a Neutral or Mixed bias and sure enough the Dow finished Lower by 65 points; but the S&P and Nasdaq both traded Higher and closed out the session in positive territory. Today we aren't dealing with a correlated markets and our bias is to the Downside.
Could this change? Of Course. Remember anything can happen in a volatile market.
Commentary
Yesterday we received the PPI data that showed Producer Price Index Lower which is good for consumers, however Unemployment claims came in Higher than expected and we've seen that for the past couple of weeks. We have long said that the Federal Reserve could drive this economy into a ditch. How? People stop or slow down consumer spending and layoffs start to happen. Why? High interest rates mean borrowing isn't on the table and now the Fed will lower rates to zero or near zero to compensate for their inaction. Think that can't happen? It already has happened in the early 2000's and more recently during the financial meltdown. Interest rates have only gone up in the last couple of years. Today we have University of Michigan Consumer Sentiment and Inflation expectations. These are major reports that the Fed will take into consideration but now it appears that the Fed will only lower rates once this year as opposes to the 3 or 4 times previously considered. So much for the soft landing.
Author

Nick Mastrandrea
Market Tea Leaves


