Dollar weakness back on track with old trends renewing

Market Overview
After a brief yet volatile reprieve of recovery, the US dollar is being sold off again. It seems that markets are increasingly able to digest the news of strengthening US inflation which is driving US yields higher. However, focus seems to be elsewhere, with long term fundamental concerns over the burgeoning US twin deficits weighing on the greenback. Unless there is a significant shift in FOMC rate hike expectations, the negative trend on the dollar seems to be set. This is driving a key upside breakout on EUR/USD to multi-year highs, with Dollar/Yen at 15 month lows. It is also interesting to see the react to the higher than expected US PPI inflation data yesterday. Similar to CPI a day before (although with less volatility) the market took the news it its stride. Although Treasury yields pulled higher, the dollar weakness helped equity markets gain ground and commodities pull higher. A continuation of this sentiment would seemingly have the December/January trends back on track.
Wall Street closed around the highs of the day with the S&P 500 +1.2% at 2731, whilst Asian markets were also strong (Nikkei +1.2%) as the Lunar New Year begins. European markets are also once more showing solid gains in early moves. In forex, the dollar weakness is evident across the major pairs. The Japanese yen is showing limited reaction to the news that Bank of Japan Governor Kuroda has been nominated for a second term. In commodities, once more we see the weaker dollar helping to support gold higher and also the oil price seems to now have turned a corner to pull higher once more.
During the European morning, traders will be looking out for the UK Retail Sales which are released at 0930GMT and are expected to show ex-autos Retail Sales gaining by +0.6% for the month and improving back to +2.5% for the year (from +1.3% last month). Into the afternoon, US traders will be looking out for US Building Permits at 1330GMT which are expected to remain at 1.3m whilst Housing Starts are expected to improve slightly to 1.23m (1.19m last month). However the main US data will be the prelim reading of the University of Michigan Sentiment at 1500GMTwhich is expected to tick very slightly lower to 95.5 from an upwardly revised 95.7 last month. This would be the fourth consecutive month of slippage but the overall reading remains strong.
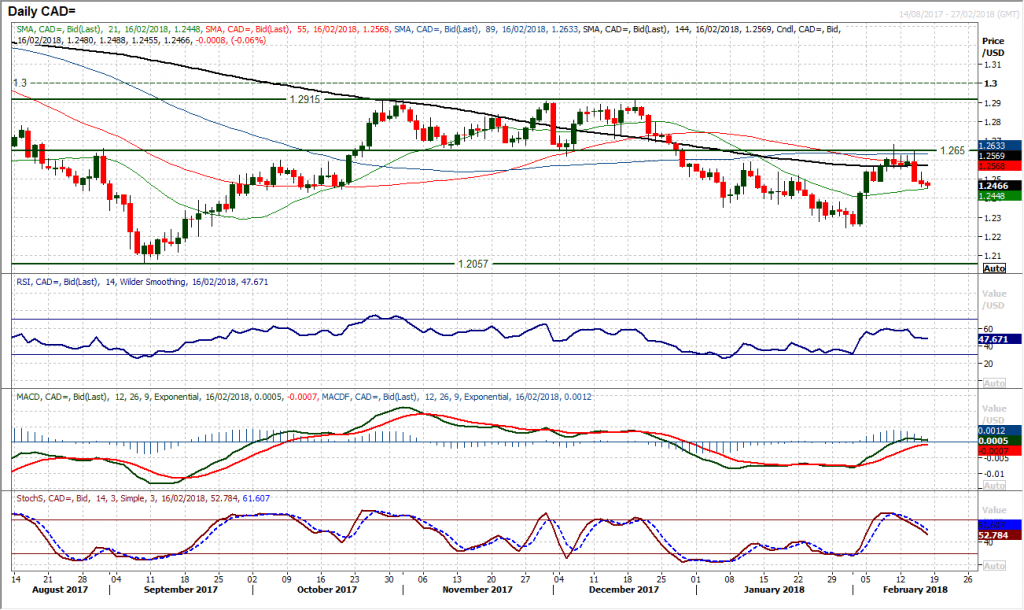
Chart of the Day – USD/CAD
A weakening dollar seems to be coming across major pairs once more, whilst commodities such as oil are also looking to bottom after recent corrective phases. This should be positive for near term positions on the Canadian dollar relative to the US dollar. This is what we are seeing on the chart of USD/CAD which has rolled over again after gains in the past couple of weeks. The negative candles are starting to rack up, with a shooting star candle at last week’s high of 1.2683 whilst a big bearish engulfing candle on Wednesday has left a lower high at 1.2650. The fact that these two highs have come around the medium to longer term pivot around 1.2650 should also not be ignored as this is now a basis of resistance. The daily RSI has rolled over around 60 again and the MACD lines are stumbling around neutral. The hourly chart also shows negative configuration and yesterday’s rebound should help to give a chance to sell, with near term resistance 1.2540/1.2550. A break back below 1.2460 opens the downside once more and if market conditions settle down again a retreat towards the January low at 1.2245 should not be ruled out.
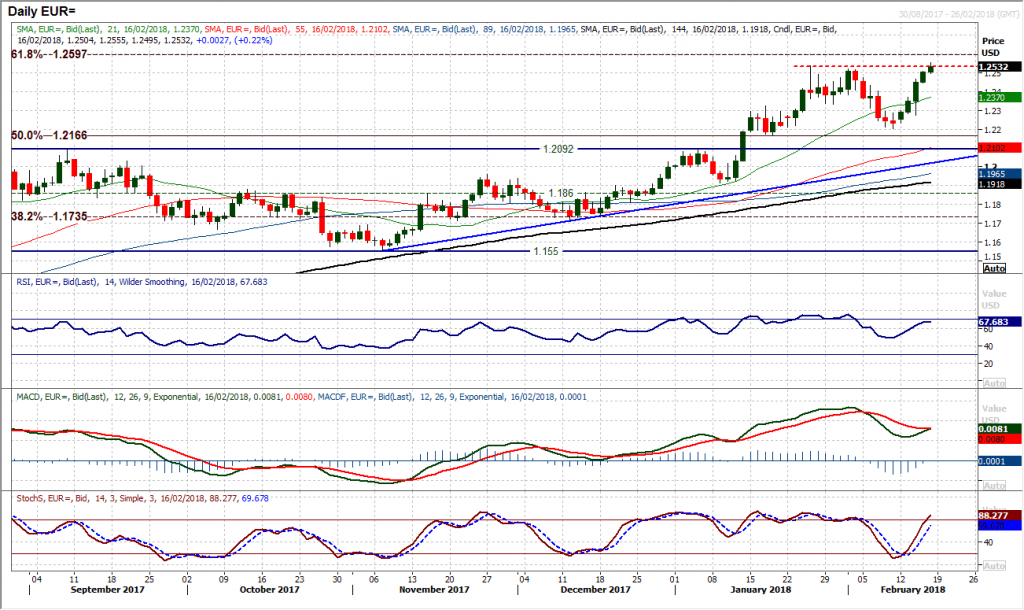
EUR/USD
The bulls are breaking out again. Having now formed four consecutive day of gains the early move higher today has breached the previous multi-year high of $1.2535 from January to see the market trading at levels not seen since December 2014. A closing upside break would mean a challenge of the next key resistance at $1.2600 which is a confluence of the 61.8% Fibonacci retracement of the huge ECB QE driven sell-off, but also a key pivot from October/November 2014. The momentum is certainly with the bulls, as the RSI pushes towards 70 with further upside potential, the Stochastics rise strongly and the MACD lines look ready to cross higher. Intraday weakness is being bought into, with a series of higher lows on the hourly chart. There is a band of support $1.2450/$1.2510 to use now as a buy zone for any weakness today.
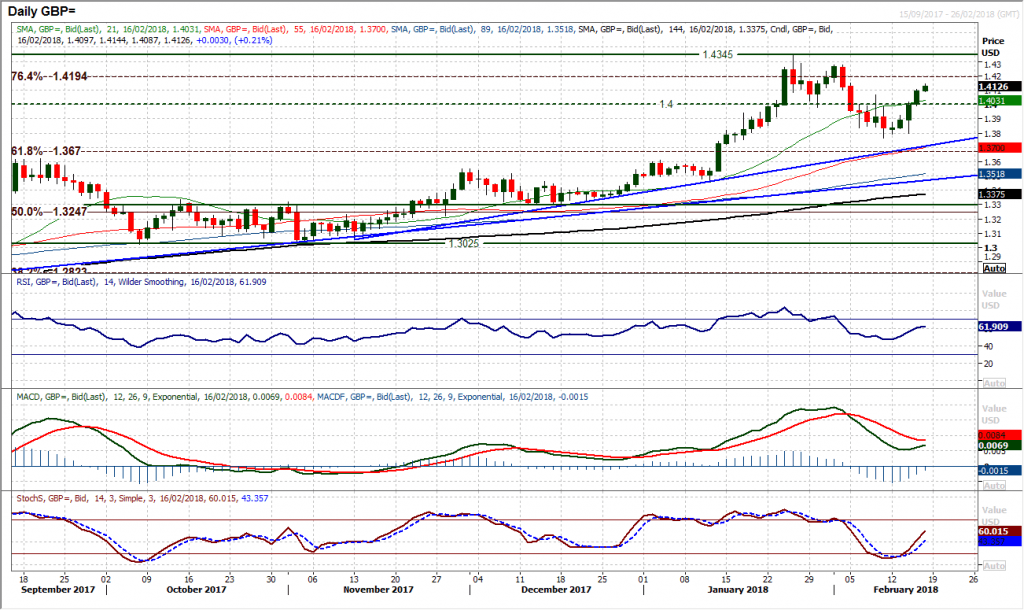
GBP/USD
Cable is another chart where we see the dollar weakness laid bare. A third consecutive strong bull candle yesterday has taken the market clear of the pivot around $1.4000 and closing above $1.4065 has re-opened the resistance of the highs at $1.4277 and $1.4345. Daily momentum configuration is strong, with the RSI rising into the low 60s and Stochastics also pulling higher, whilst the MACD lines looking to turn up again above neutral reflects the medium term strength of the trend. Weakness is now a chance to buy, with a support band now $1.3975/$1.4065. The hourly chart shows strong configuration on momentum within this rally. A minor intraday low yesterday afternoon at $1.4020 gives a marker on the hourly chart for a small base pattern too, which also points towards a test of the highs again.
USD/JPY
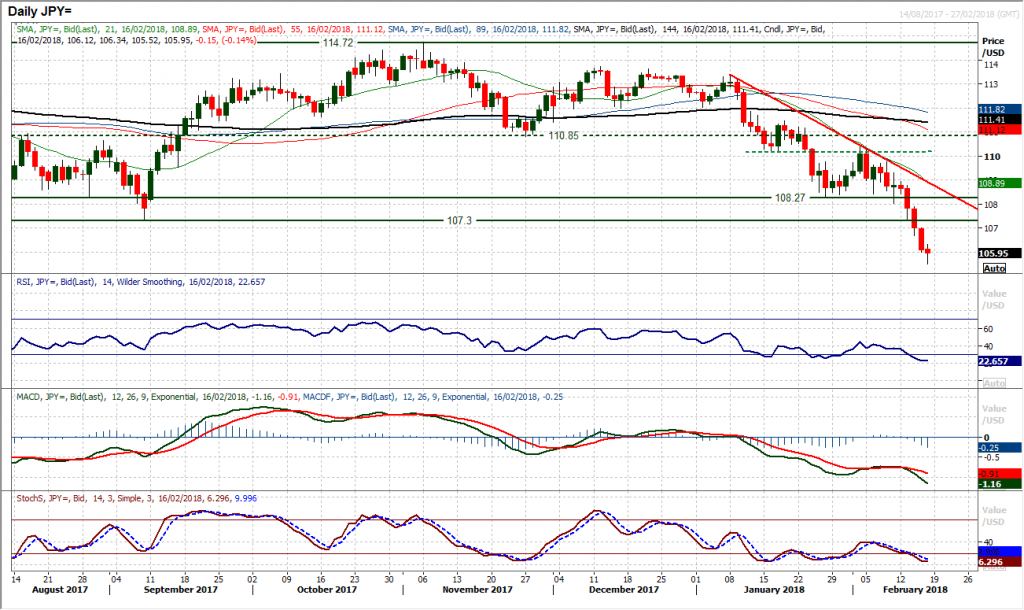
Selling Dollar/Yen continues to be a successful trade as yet another strong bear candle has been formed yesterday. The second decisive close well below 107.30 also confirms the key breakdown of the medium term range and implies further weakness potentially towards a test of 100 area in the coming months. Momentum is strongly negative and one key factor is that when Dollar/Yen trends, it is often a move that can be like an oil tanker. There is minor support around 105.50 from November 2016, however there is little real support until 102.50. Rallies will certainly be seen as a chance to sell, with the hourly chart showing a sequence of lower highs which are often coming around old support levels. Yesterday there was 106.80 and the day before was 107.50. Yesterday’s bad of support 106.00/106.15 may now become a level to watch today. The hourly chart is also showing moves to unwind the RSI are failing around 45/50 now. The one big caveat is when the BoJ looks to step in to intervene to combat the strengthening yen.
Gold
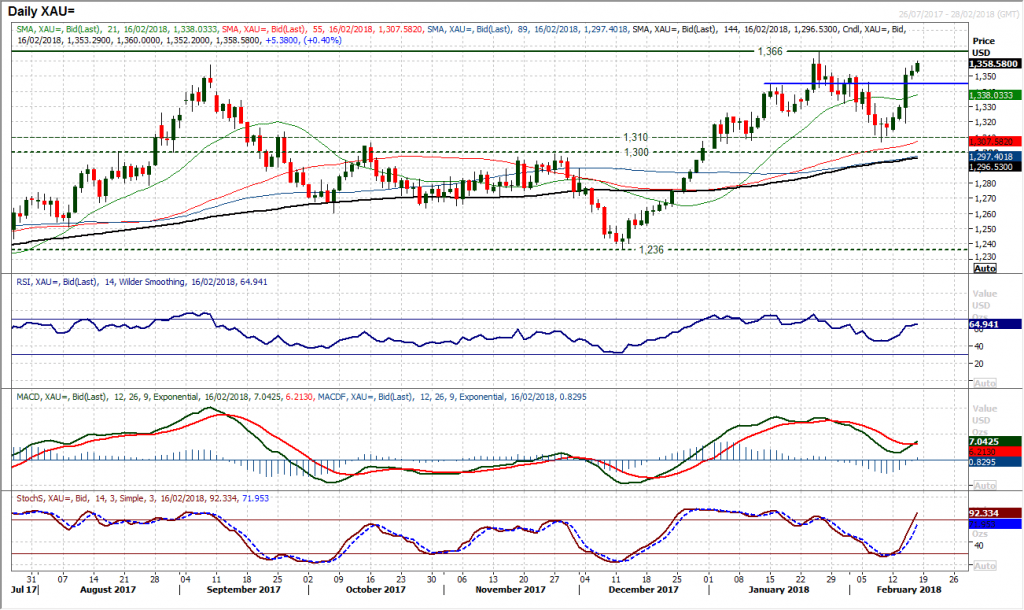
Considering the negative pressure seen across the dollar on major forex pairs, perhaps it was a touch surprising that gold did not rally more yesterday. Despite this though, another positive candle continues to suggest pressure on the January high at $1366. With the strength of the momentum indicators and the upside potential, there is a high expectation that $1366 will be breached soon. The RSI is rising into the mid-60s, with the Stochastics also advancing and the MACD lines crossing higher above neutral. Intraday corrections are being bought into and the bulls seem confident to continue to support the market. A close above $1366 opens the July 2016 high at $1375 and then the crucial high of $1391. These are massive long term resistance levels that if broken would signal a significant long term change in sentiment on gold. The hourly chart shows support at $1348 now above a previous pivot at $1344. The hourly momentum indicators are also positively configured with the RSI bottoming around 40/50 and MACD lines above neutral and crossing higher.
WTI Oil
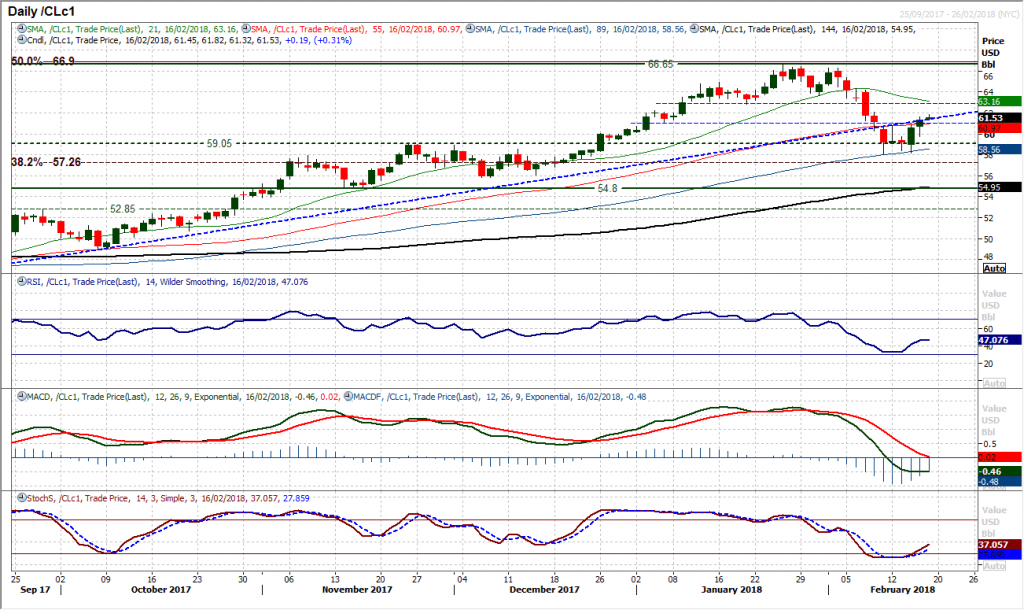
The bulls looked to be stuttered in the recovery yesterday but a strong move into the close has formed a second consecutive positive candle. Coming with the breaking of the recent mini-downtrend, this will encourage the bulls once more. Momentum indicators are still in the early stages of turning around and if the market can continue to react positively into weakness, like it did yesterday, then a resumption of the push higher will follow. The key for oil is that the support band $58.10/$59.10 now remains intact as a floor for the recovery. The hourly chart shows the formation of a higher low at $59.70 as the market just unwound some initial near term overbought positioning. The support band $59.50/$60.00 will be seen as a basis of support for the bulls today. The high at $62.10 will ow be seen as a gauge for renewed bull control in WTI and a decisive upside breakout would open resistance at $62.85.
Dow Jones Industrial Average
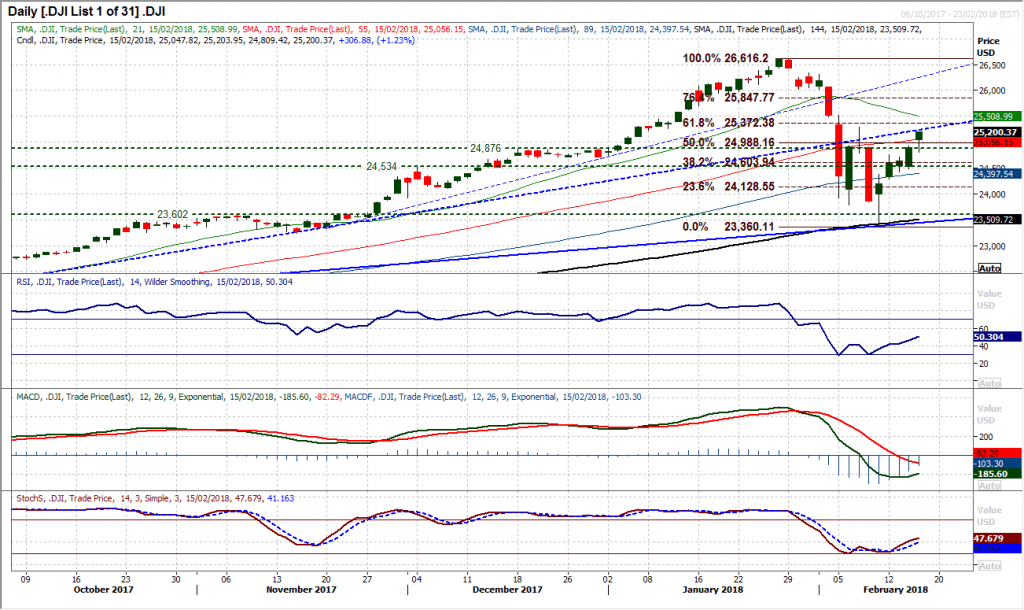
The market continues to push forward in a recovery and yesterday’s session will have given the bulls increased confidence. Having stuttered initially in filling a bullish upside gap, the market closed strongly at the high of the day for a fifth consecutive session of gains. A daily range of just shy of 400 ticks is still elevated volatility but considering the Average True Range is still well above 600 ticks, yesterday’s move reflects solid gains on a relative basis. The hourly chart shows a band of support 24,765/24,925 and the hourly RSI is now strongly configured with weakness being bought into. The recovery remains in play whilst the support at 24,420 remains intact. For now the bulls are eyeing the key resistance now at the spike high of 25,293 as an upside break would confirm the strength of the recovery. Subsequent resistance is at 25,520.
Author

Richard Perry
Independent Analyst


