Dollar remains strong ahead of US Q3 GDP

Market Overview
Markets have become very choppy in recent days, but there are still some key moves being seen. Bond yields continue to rise as bonds are being sold off. The latest catalyst was the better than expected rise in UK GDP growth for Q3 yesterday which drove UK Gilt yields higher and the mood was reflected across other key bond markets. The dollar remains strong ahead of the key US Q3 GDP growth announcement today, whilst Treasury yields are pushing strongly higher with the US 10 year yield now above 1.85%. This is helping to maintain the dollar strength as expectations of a Fed rate hike in December continue to climb, with the CME Group Fed Watch tool now pricing a probability percentage in the high 70s. This sell-off on bonds, with bond yields higher is also impacting across Dollar/Yen which has broken out to its highest level since July. Equity markets are though more reticent and choppy, with Wall Street closing lower again despite the apparent relative strength of earnings season so far.

The S&P 500 closed 0.3% lower at 2133 whist Asian markets were mixed (Nikkei +0.6% on the weaker yen), and European markets again cautious at the open. In forex markets there is little real direction although the yen continues to weaken against the dollar after Japanese inflation was again -0.5% . Gold and silver remain supported whilst oil is also trading around the flat line.
US economic data is of key importance today with Advance Q3 GDP growth at 1330BST. The market is expecting an improvement in the annualised data to +2.5% (from the final reading of +1.4% in Q2). There is also the quarterly Employment Cost Index at 1330BST which is expected to remain at +0.6%, whilst the Michigan Sentiment for October is expected to be revised mildly higher to 88.1 (from the preliminary reading of 87.9).
Chart of the Day – EUR/JPY
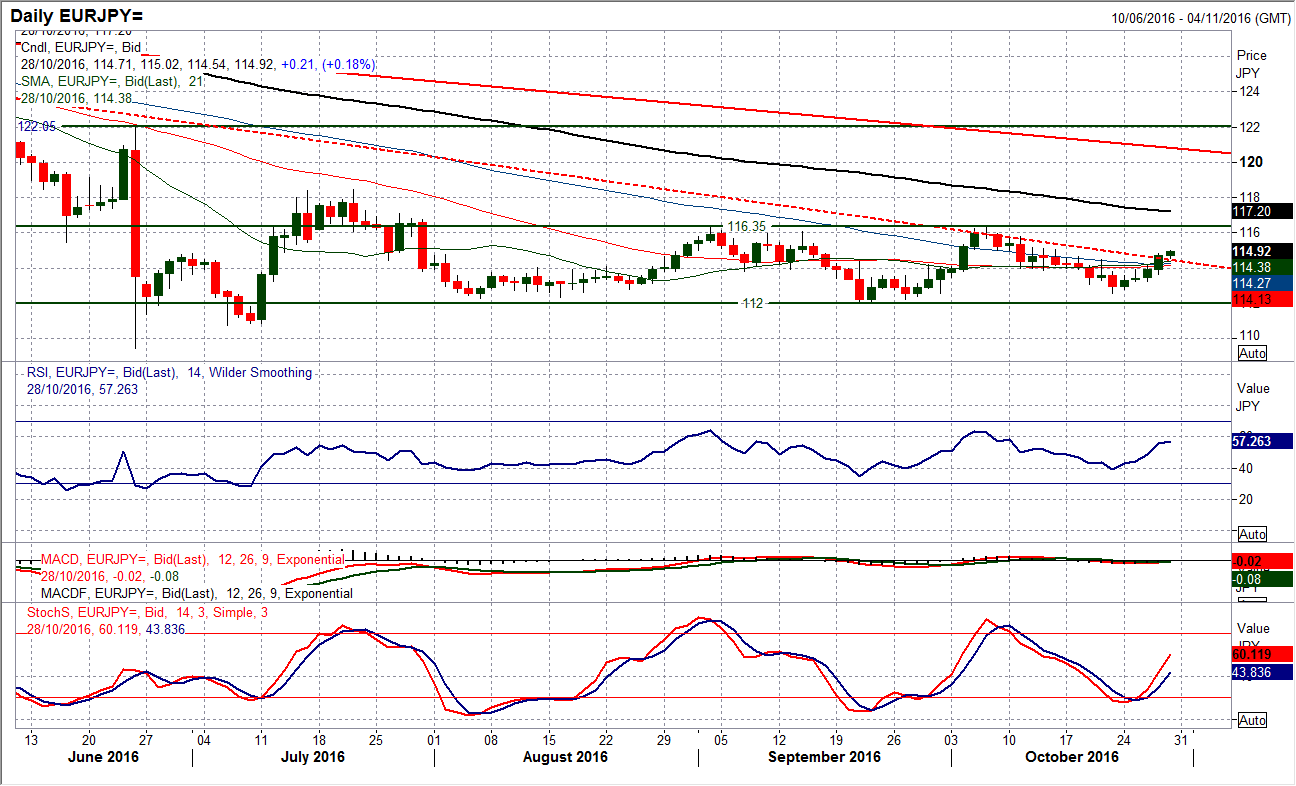
The yen is no longer the force of strength in forex that it once was. With Dollar/Yen basing out and now breaking higher, it is now interesting to see the yen is no longer strong against the euro either. In the past three months the euro has traded in a sideways range against the yen with the support of a range around 112.00 (which is also a higher low above the key June spike low at 109.45). It is interesting to see the daily momentum indicators now far more configured for range bound trading too. The Stochastics have crossed bullishly for another near term buy signal, the fourth in four months with the previous three all being successful in calling rallies. The RSI has also pickup up once more off 40 and is moving steadily now higher. The rally highs of the range both came in early September and early October in around 116.35 with the RSI in the low 60s. This would suggest that this rally has further legs in it. The hourly chart shows recent lower highs are now being taken out, and there is an inverted head and shoulders base pattern through 113.95 which implies 115.35. There is also a key pivot around 114.00 which will be seen as a buying opportunity for a pullback. Intraday corrections now seen as a chance to buy.
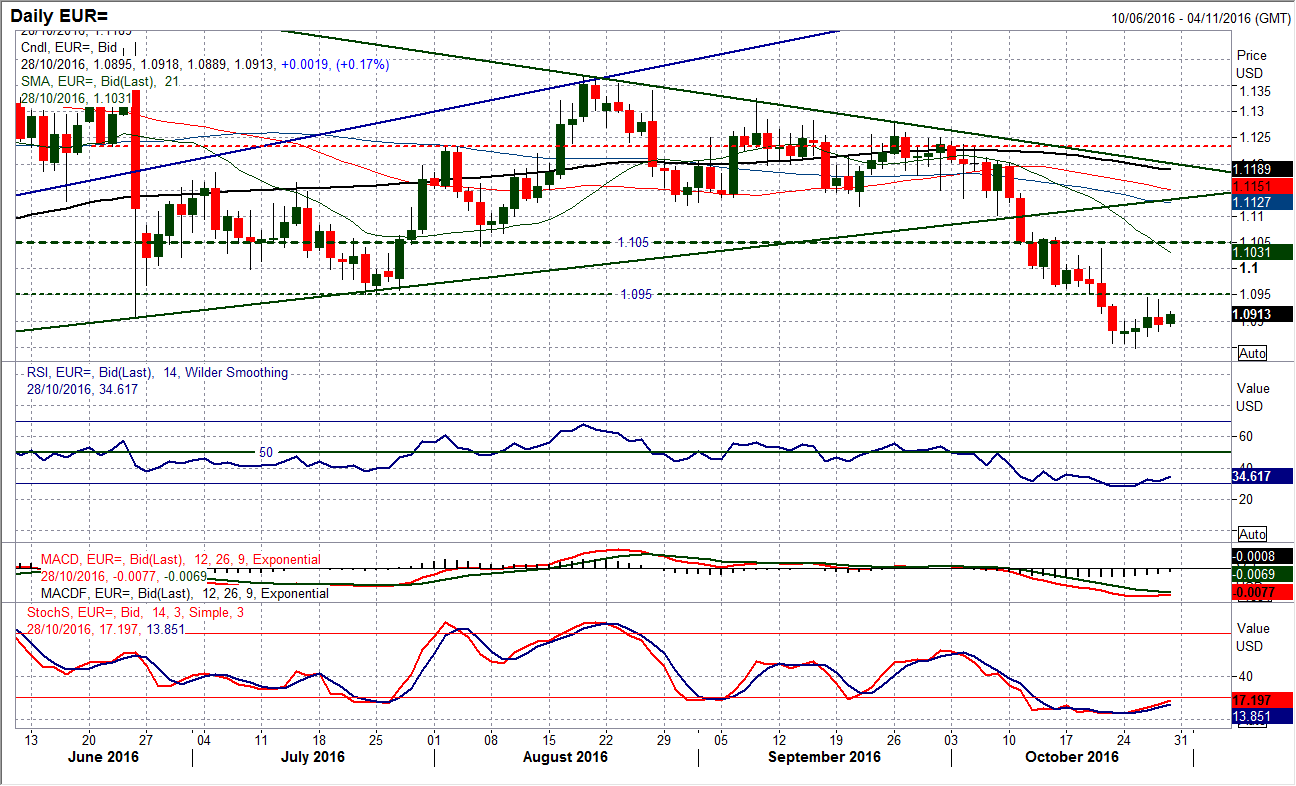
Having broken below the key support at $1.0950 last week, this is now clearly a level that the market is cautious of and is an area of overhead supply. The last two days have had intraday attempts higher that have been sold into and yesterday’s candle closed back towards the low of the day. I am a seller into any strength on the euro and believe that the next lower high will come between $1.0950/$1.1050, so the overhead resistance is now being added to. The daily momentum indicators are not leading a recovery and still look very cautious, fully reflecting a sense that the bears are still in control and any rebound would be a bear market rally. The hourly chart is a little more positive but there is clearly a lot that needs to be done to improve the outlook, starting with a decisive move above $1.0950. If the hourly RSI starts to drop back below 40 this would reflect a deterioration in the near term outlook again. The last two day lows have left initial support at $1.0870/$1.0880, which is protecting $10.848 and I still expect a retreat to $1.0800.
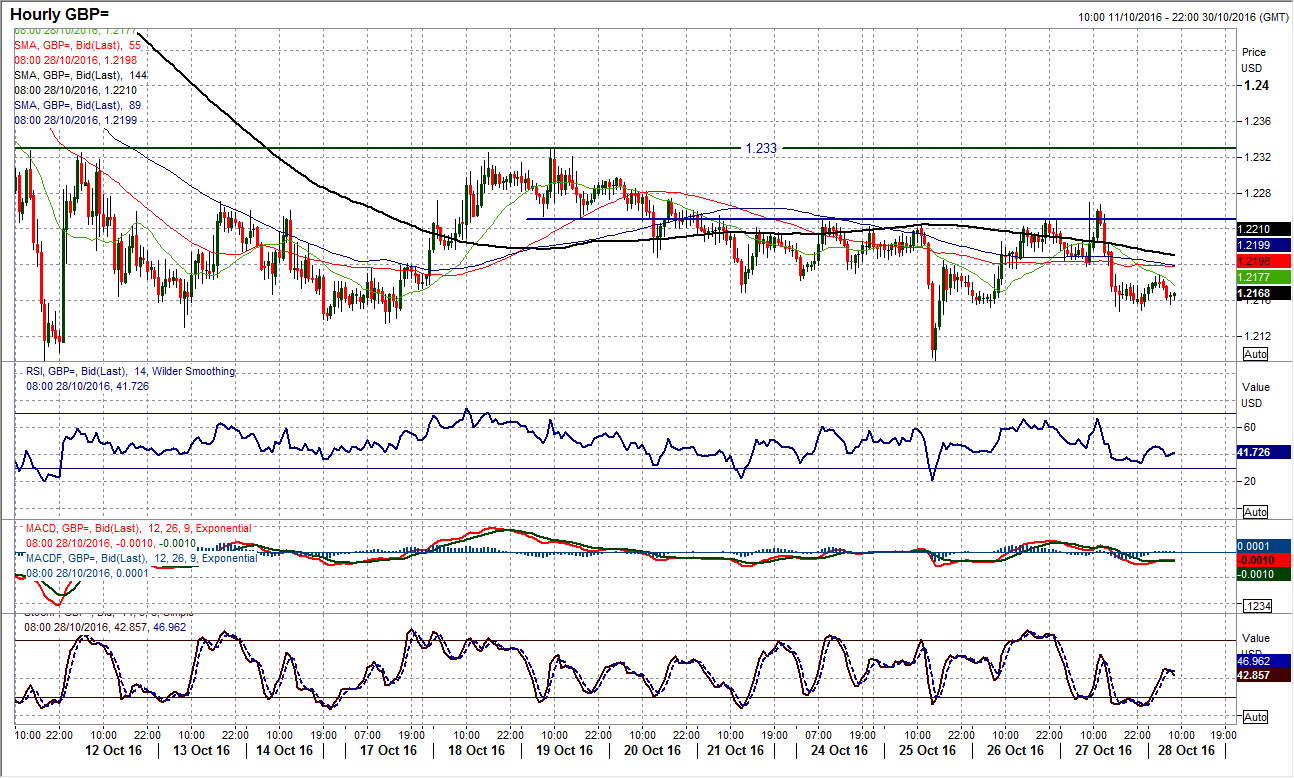
Another bearish candle has put the pressure back on the low of the range again. Despite the strong UK GDP data, sterling got sold into and a bearish outside day has put the sellers back in control again. The hourly chart shows that there is a negative bias to the near term outlook with all the hourly moving averages drifting lower and the market challenging the support around $1.2150 this morning. The hourly momentum indicators though are not excessively bearish and actually still have a ranging look to them, so whilst the range low at $1.2080 is the next real support, there is no compelling technical impetus to breach it, for now. However, the resistance of $1.2250 was breached in the wake of the UK growth data but the bulls failed at $1.2270 which now takes on increasing importance as resistance. This remains a range play between $1.2080/$1.2330 and there is a negative bias to the near term trading, however I expect the range to continue. Watch out for US GDP this afternoon which will be a driver of volatility.
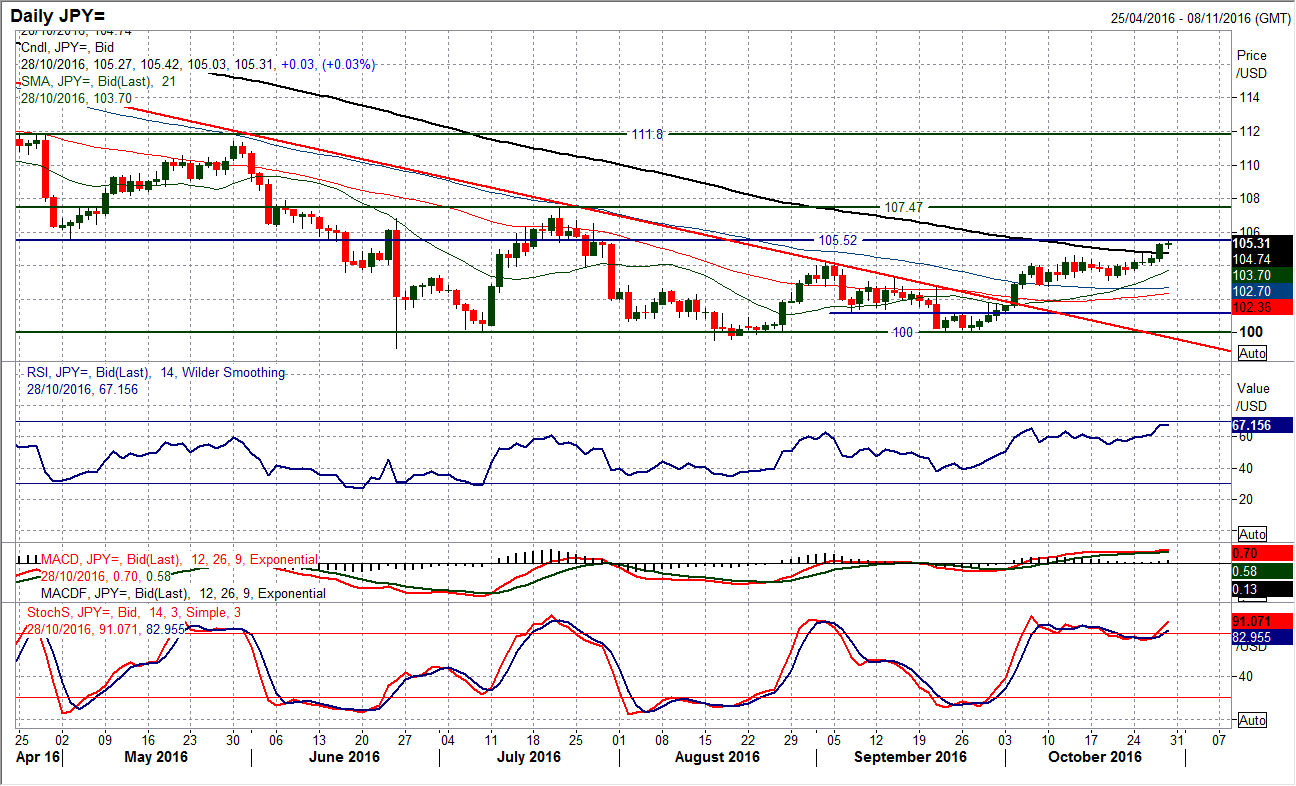
Having broken the shackles of the resistance at 104.30 in the previous session, the bulls took control yesterday and posted the strongest candle for three weeks, closing towards the high of the day. The move has been accompanied by the confirmation on the RSI which has pushed towards the high 60s and the Stochastics are gathering momentum also. The bulls are now looking higher towards the initial resistance at 105.50 but the next main stopping area is 107.47 which was the key July high. Corrections continue to be bought into with the market posting a series of higher lows. The hourly chart has formed a nice uptrend in the past seven sessions and hourly momentum is increasingly positively configured suggesting rallies are being bought into. There is an initial band of breakout support 104.60/104.87 with the uptrend coming in around 104.40/104.50 today. Overhead resistance comes in around 105.50 and 106.50, with 107.47 now key.
Gold
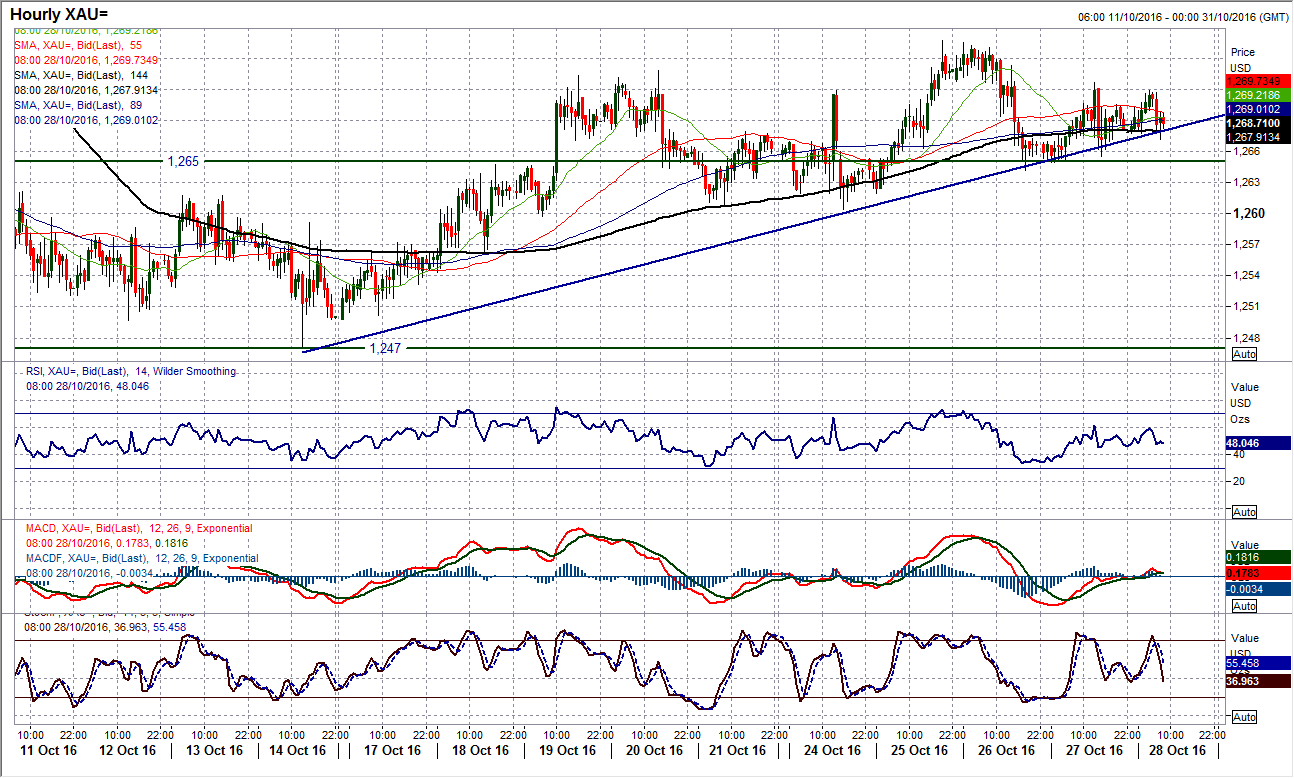
Is the rally tiring? Gold is still hanging on to the support around $1265 which is the neckline of the reversal pattern that continues to target a redound to $1283. The concern is though that the bulls are struggling to regain the traction that resulted in a rally to $1277. The uptrend on the hourly chart in the past two weeks is holding but is creaking and momentum configuration on the hourly chart is less positively configured than previously seen through the recent rebound. The daily chart shows Wednesday’s corrective candle has been followed up by a very meekly positive candle yesterday. Furthermore, the momentum indicators are also beginning to look a little tired and are threatening to lose impetus. I am still happy to back the recovery but am beginning to get concerned by the fact that this is a bear market rally and bear market rallies will tend to undershoot their upside targets (in this case $1283). I am a cautious near term bull but would still be looking to sell on a medium term rally.
WTI Oil
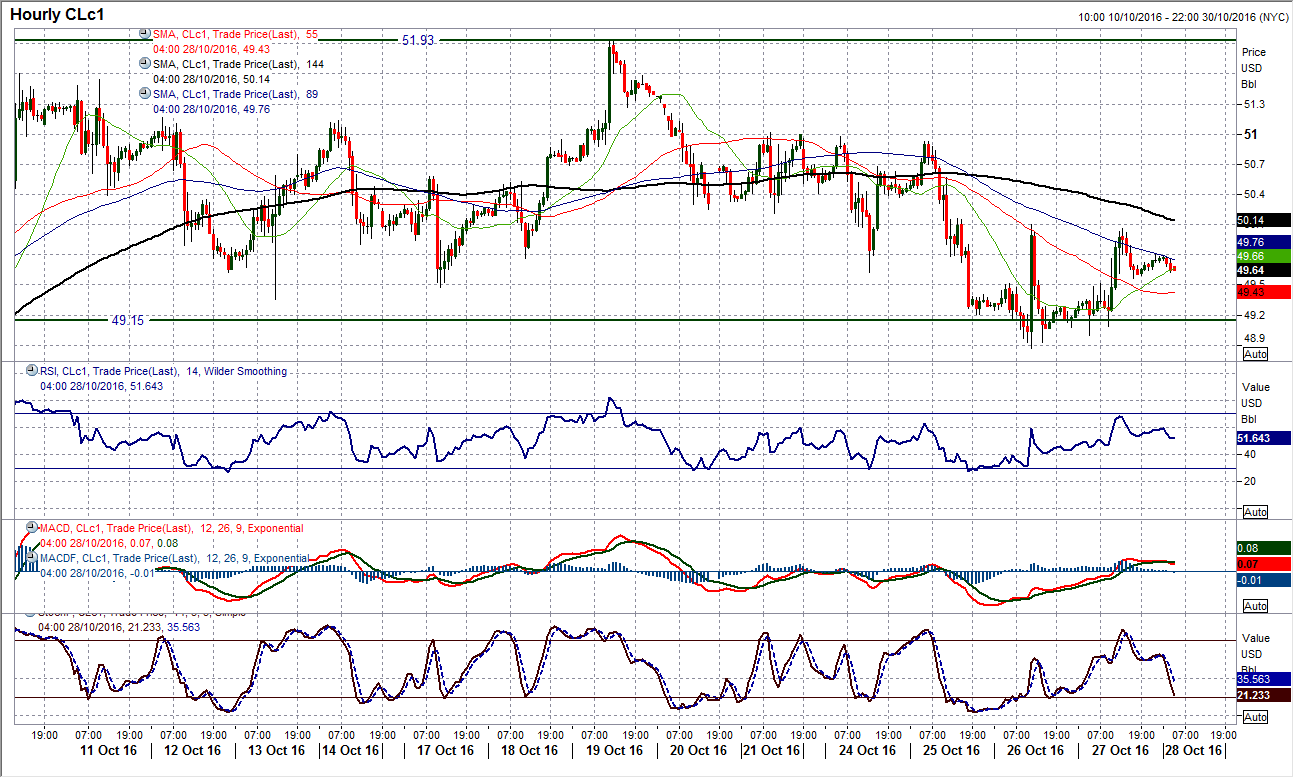
The bulls are still hanging on in the recent consolidation, but can this continue? The support around $49.15, although broken intraday on Wednesday, held through the session on Thursday and the bulls have managed to post a positive candle. However, the corrective outlook remains on the daily chart and the series of lower highs over the past week suggests the bulls still need to do more to prevent further selling pressure from resuming. The spike high at $50.10 (following the EIA inventories) as initial resistance was tested yesterday afternoon but remains intact. This becomes an important level today, however this is still just a barrier between the main near term resistance at $51.00. The hourly momentum has picked up but is already beginning to deteriorate again and failing below 70 suggests that the rallies are still considered to be a chance to sell. I am expecting another lower high below $51.00 today (preferably below $50.10) before pressure resumes on $49.15. A close below $49.15 completes the top that implies $47.70.
Author

Richard Perry
Independent Analyst


