DC still duking it out [Video]
![DC still duking it out [Video]](https://editorial.fxstreet.com/images/Markets/Equities/curved-stock-exchange-ticker-numbers-and-arrows-on-black-58549212_XtraLarge.jpg)
US Dollar: Sept USD Down at 94.805.
Energies: Aug'20 Crude is Up at 42.32.
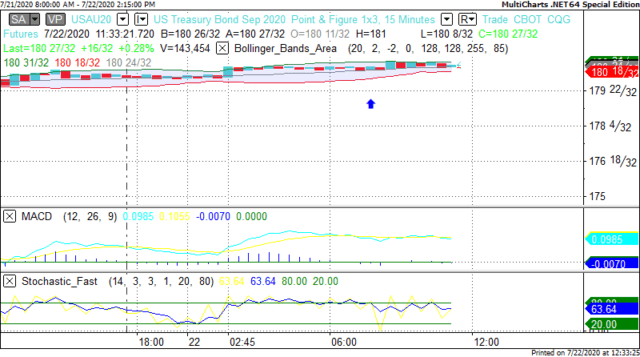
Financials: The Sept'20 30 year bond is Up 3 ticks and trading at 180.23.
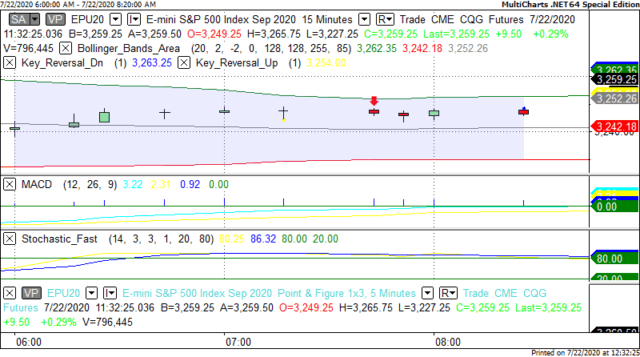
Indices: The Sept S&P 500 emini ES contract is 46 ticks Higher and trading at 3277.00.
Gold: The Aug'20 Gold contract is trading Up at 1880.70. Gold is 156 ticks Higher than its close.
Initial Conclusion
This is not a correlated market. The dollar is Down- and Crude is Up+ which is normal but the 30 year Bond is trading Higher. The Financials should always correlate with the US dollar such that if the dollar is lower then bonds should follow and vice-versa. The S&P is Higher and Crude is trading Higher which is not correlated. Gold is trading Higher which is correlated with the US dollar trading Down. I tend to believe that Gold has an inverse relationship with the US Dollar as when the US Dollar is down, Gold tends to rise in value and vice-versa. Think of it as a seesaw, when one is up the other should be down. I point this out to you to make you aware that when we don't have a correlated market, it means something is wrong. As traders you need to be aware of this and proceed with your eyes wide open.
At this time Asia is trading Mixed with half the exchanges Higher and the other half Lower. Currently all of Europe is trading Higher with the exception of the Milan exchange which is Lower.
Possible Challenges To Traders Today:
-
Unemployment Claims are out at 8:30 AM EST. This is Major.
-
CB Leading Index is out at 10 AM EST. This is Major.
-
Natural Gas Storage is out at 10:30 AM EST. This is Major.
Treasuries
We've elected to switch gears a bit and show correlation between the 30 year bond (ZB) and The S&P futures contract. The S&P contract is the Standard and Poor's and the purpose is to show reverse correlation between the two instruments. Remember it's liken to a seesaw, when up goes up the other should go down and vice versa.
Yesterday the ZB made it's move at around 7:30 AM EST. The ZB hit a Low at around that time and the S&P moved Lower. If you look at the charts below ZB gave a signal at around 7:30 AM EST and the S&P moved Lower at around the same time. Look at the charts below and you'll see a pattern for both assets. ZB hit a Low at around 7:30 AM EST and the S&P was moving Lower shortly thereafter. These charts represent the newest version of MultiCharts and I've changed the timeframe to a 15 minute chart to display better. This represented a Long opportunity on the 30 year bond, as a trader you could have netted about 10 ticks per contract on this trade. Each tick is worth $31.25. Please note: the front month for the ZB is now Sept '20. The S&P contract has been changed to Sept '20. I've changed the format to Renko bars such that it may be more apparent and visible.
Charts Courtesy of MultiCharts built on an AMP platform
Bias
Yesterday we gave the markets a Neutral bias as we saw little evidence of market correlation. A Neutral bias means the markets could go in any direction and often does. The markets however had other ideas as the Dow gained 165 points and the other indices advanced as well. Today we aren't dealing with a correlated market and our bias is Neutral.
Could this change? Of Course. Remember anything can happen in a volatile market.
Commentary
The GOP is apparently waging a war within it's own party as there is no consensus at this time as to what the stimulus bill should contain. There are many in the party who want to cut off any further unemployment benefits to those who need it. The President wants a payroll tax cut which will do virtually nothing for the common worker except maybe put some gas in their cars. The one aspect that everyone seems to agree with is a stimulus check liken to what was received this past spring, however the amount is still in debate at this time. It is apparent that the bill that the GOP wants versus what the House has already approved will be dramatically different, so it all comes down to compromise. Time will tell how it all works out...
Author

Nick Mastrandrea
Market Tea Leaves


