Market Overview
The rout is continuing and is now beginning to get rather nasty. Huge selling pressure on Wall Street into the close on Friday has got even worse in Asia today. With concerns over a slowdown in China and commodity prices on a slippery slope, market sentiment is taking a pounding. New measures introduced to allow pension funds in China to invest in equity markets for the first time have done little to stem the flow of selling pressure. The Shanghai index was down 8% today, with other Asian markets also sharply lower, the Nikkei 225 was down 4.6%. This has obviously translated to something of a disastrous open in Europe with huge losses. With no good news to point to, this does have a climactic sell-off feel to it, but as ever in these situations, calling the bottom is an incredibly difficult game.
Interestingly it seems as though the market is re-rating the dollar as the market makes a call that a Federal Reserve rate hike is slipping ever further into the future. The dollar has come under some significant pressure against the euro (unwinding the carry trade) and the yen (flight to safety). Interestingly Cable is fairly stable still, perhaps as the market views the global macro picture could also impact on the Bank of England’s ability to hike rates in the coming months. With commodity prices again feeling the strain, currencies such as the Aussie, Kiwi and Canadian Loonie are all again feeling the strain. The price of precious metals, normally perceived as a safe haven, have been strangely weak today, with gold falling by around $5.
There is little to take the attention off the market rout today, with no economic announcements for traders to get their teeth into.
Chart of the Day – USD/CAD
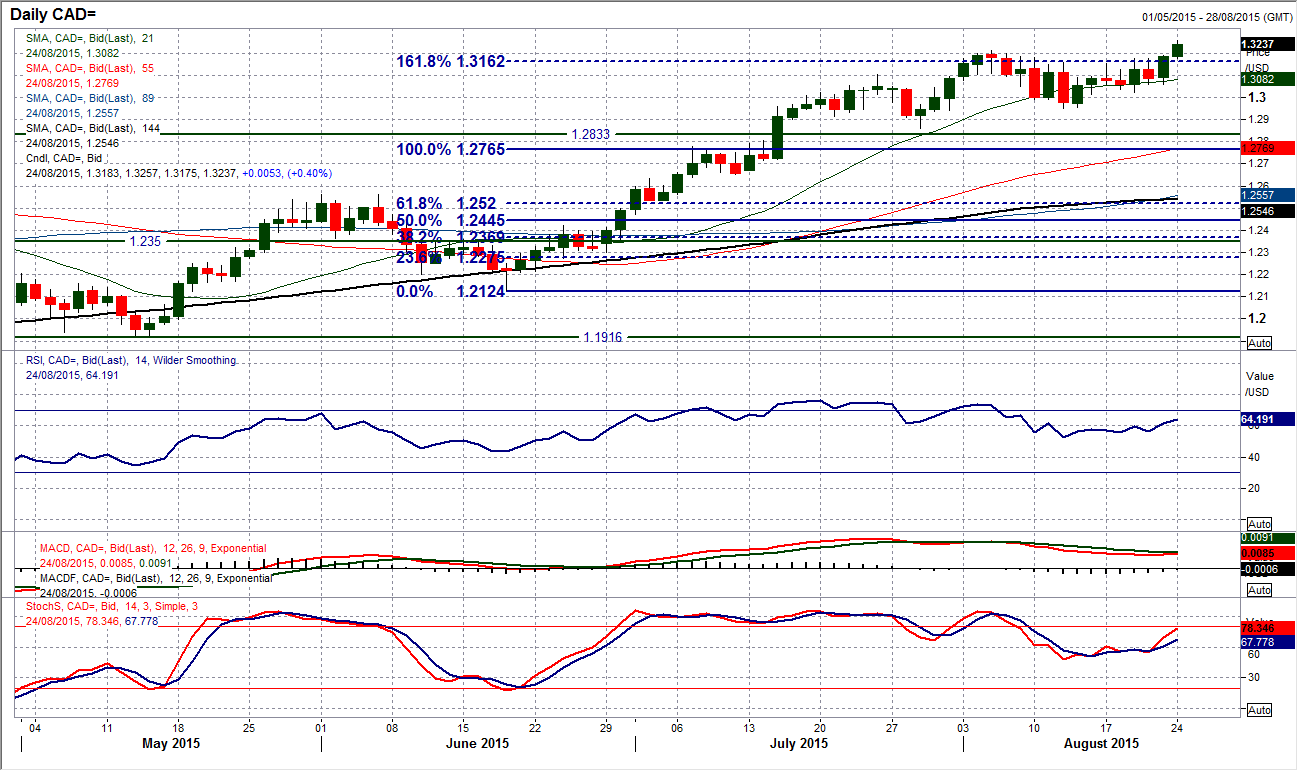
Perhaps in the interest of fairness as much as anything it is best to consider charts that the dollar is not under pressure against. The commodity currencies are all weaker against the US dollar today and with oil continuing to break ever lower, it is interesting that we are now seeing the Canadian Loonie sold off too. Having seen a bout of consolidation in the past few weeks, the chart of USD/CAD has broken higher again. This move above $1.3213 has seen the bulls resume control again. The move is coinciding with the improvement in momentum with Stochastics and RSI turning higher again and the outlook is certainly improving. The next aspect to look for is a closing breakout above the resistance today. Furthermore, it would be good to see a minor correction finding support around the breakout before pulling higher again. The intraday hourly chart shows the support band $1.3175/$1.3213. The upside potential on the momentum indicators suggests there is plenty of room now to run higher if the shackles can be successfully removed. There is no resistance until around 134 and then 138, levels not seen since mid-2004.
EUR/USD
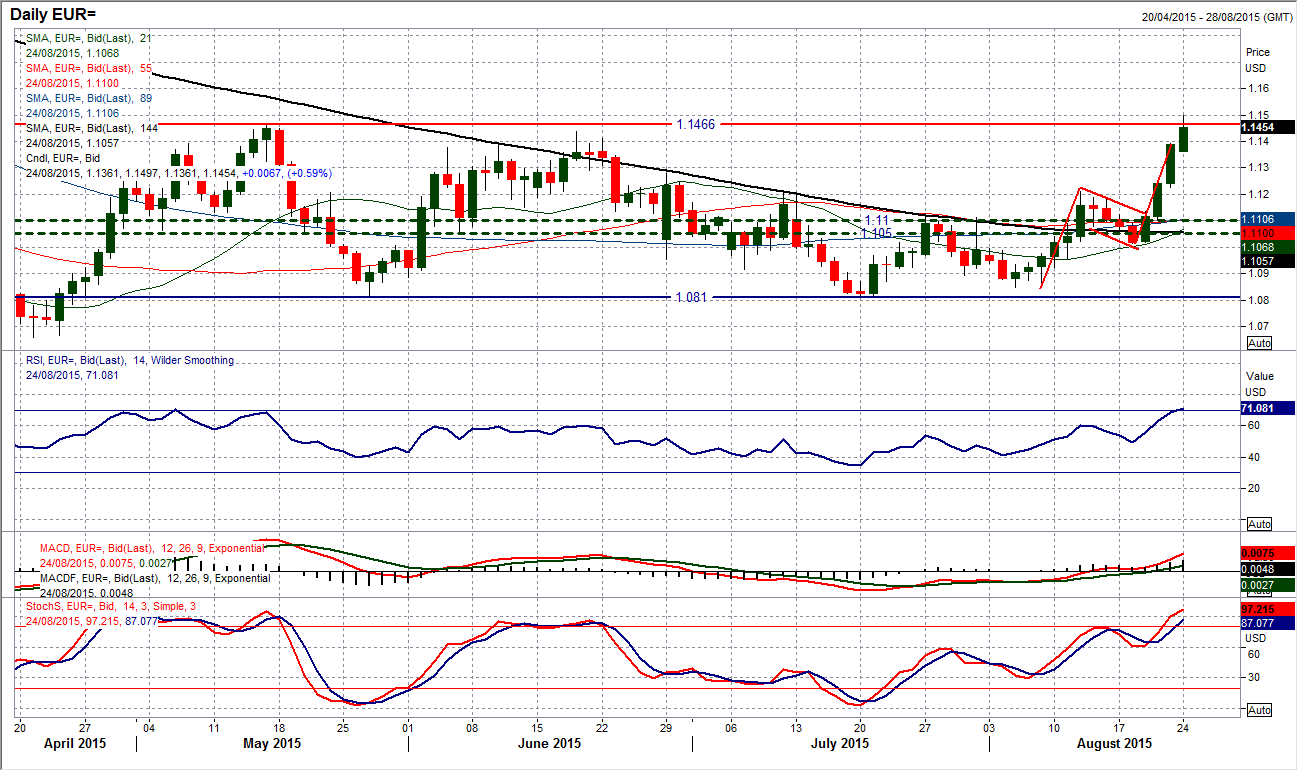
There must be some significant short euro/long dollar positions unwinding at the moment as the price of EUR/USD has short higher in the past three completed sessions, and early Monday morning has continued its path higher. The chart even shows a move above the multi-month resistance at $1.1465 which has been in place since January. The momentum indicators are clearly strong and if this resistance cannot hold back the move then it might be difficult to say where is might stop. A close above $1.1465 (a 2 day close above would be safer) would confirm a breakout and then there would need to start being a serious reassessment of the break. The RSI is now at 71 and is now at the highest since May, whilst Stochastics and MACD both agree too. This is all pointing towards a breakout and the market accepting it. The intraday hourly chart shows everything is bullish, with initial support not until around $1.1350. This is a run to go with, but keeping stops tight as can often be seen with these moves, if the profit taking sets in the unwind can be sharp too. The overnight high is $1.1497 before a 50 pip correction, which appears as a mere blip on the chart now, such is the strength of the rally.
GBP/USD
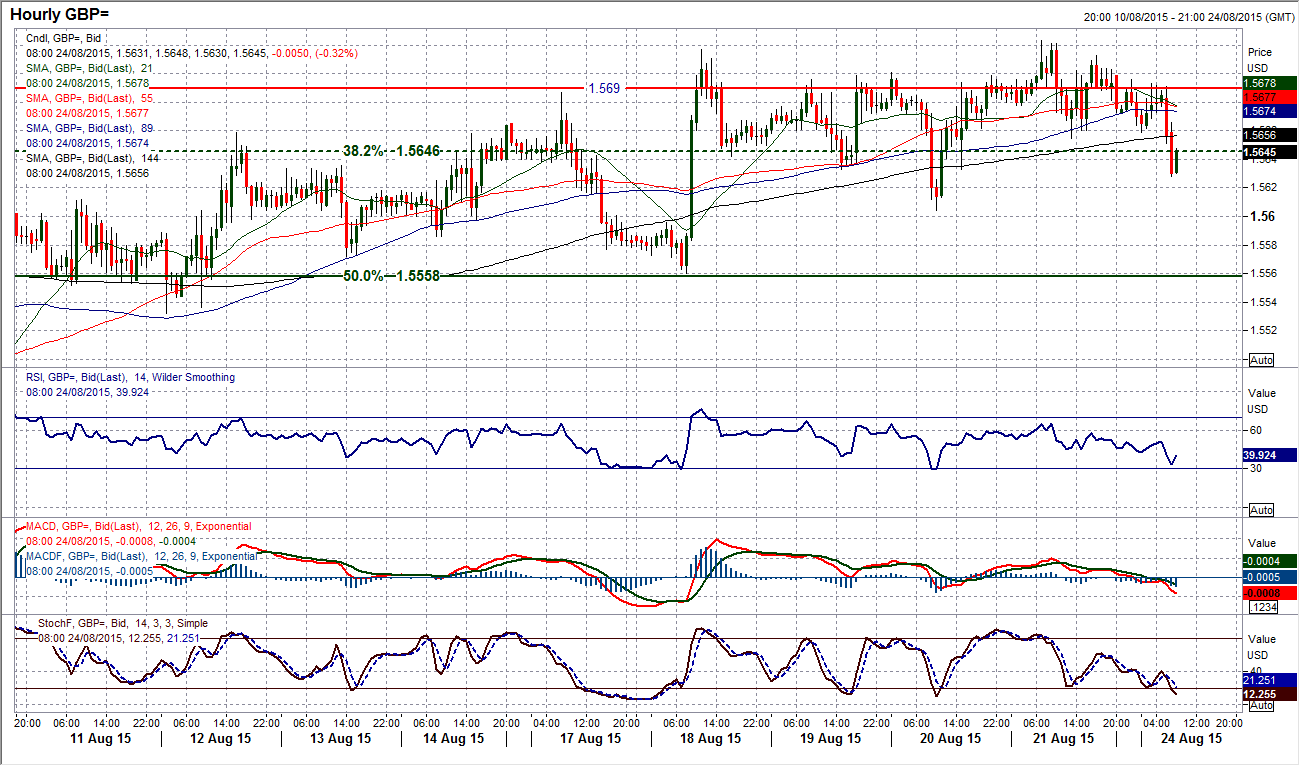
By my own admission, the breakout from the trading range has now been confirmed by a close above $1.5690. However has been a very slow and gradual grind higher (compare Cable with other key forex major pairs that are moving with significant conviction). Daily momentum is reasonably positive but I am still wary of the lack of drive higher in this move, summed up in a way by Cable trading lower on a morning when the way the chart is configured, you would expect a conviction upside break to be seen. This leaves Cable susceptible to a correction (which is already threatening) and especially if the market undergoes a change of outlook. The intraday hourly chart shows Friday’s creep to another intraday high has left resistance at $1.5723 but the hourly momentum shows a distinct lack of conviction (perhaps even bearish divergence). Again this is a chart to keep close with profit triggers on long positions. The support comes in around the 38.2% Fib level at $1.5646 and then at $1.5603.
USD/JPY
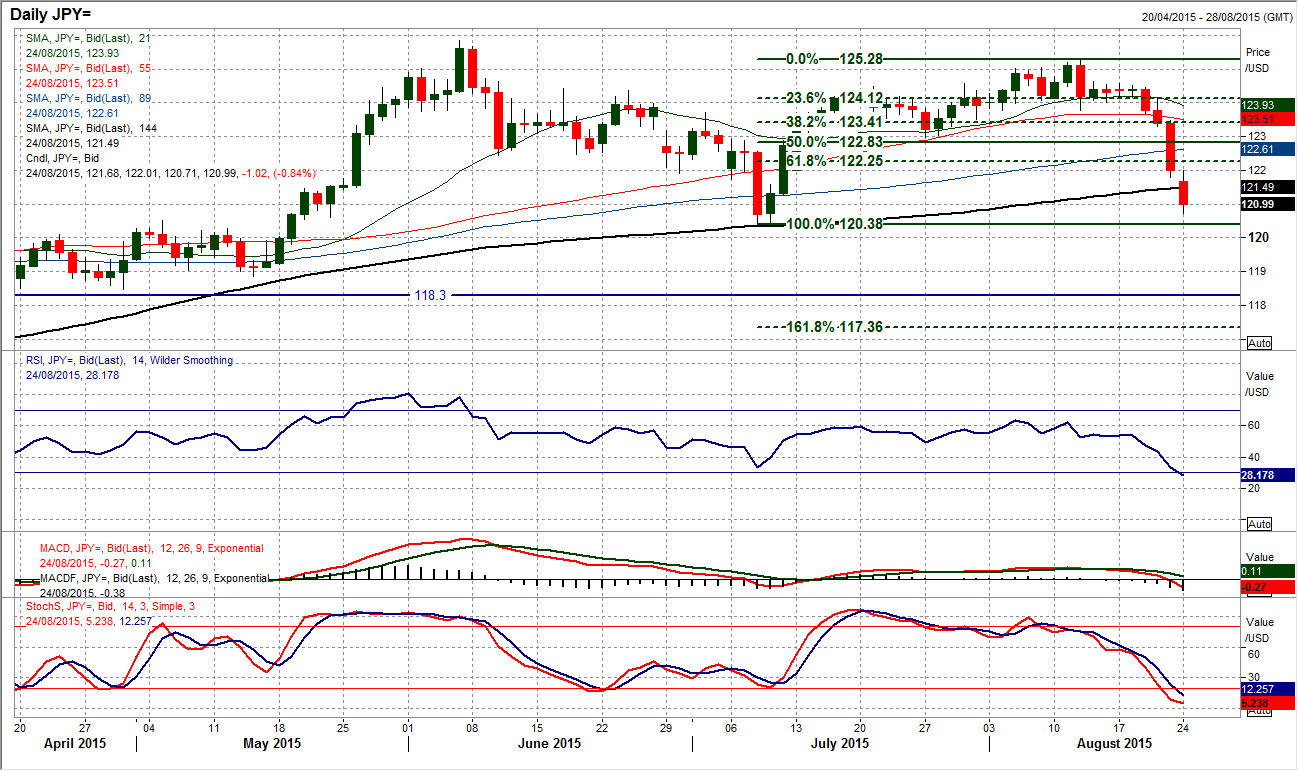
The flight into safe havens has seen the yen benefit significantly in the past few days and this trend continues today. The move has now burst through several key supports on Dollar/Yen with 122.00 (a historic key support) not providing much of a buffer against the dollar sellers. The move is now within touching distance of testing the key July low at 120.38. The technical indicators continue to deteriorate, with the RSI back at 30 (and the lowest level since July 2011) the Stochastics remaining negative whilst the MACD lines are also now entering bearish territory. The intraday hourly chart shows consistent decline in the past few days and there have been occasional bouts of consolidation which will come in as the initial lines of resistance around 122.00/122.30. If the support at 120.38 was cleared then it would re-open 118.86/118.30 supports back from April/May.
Gold
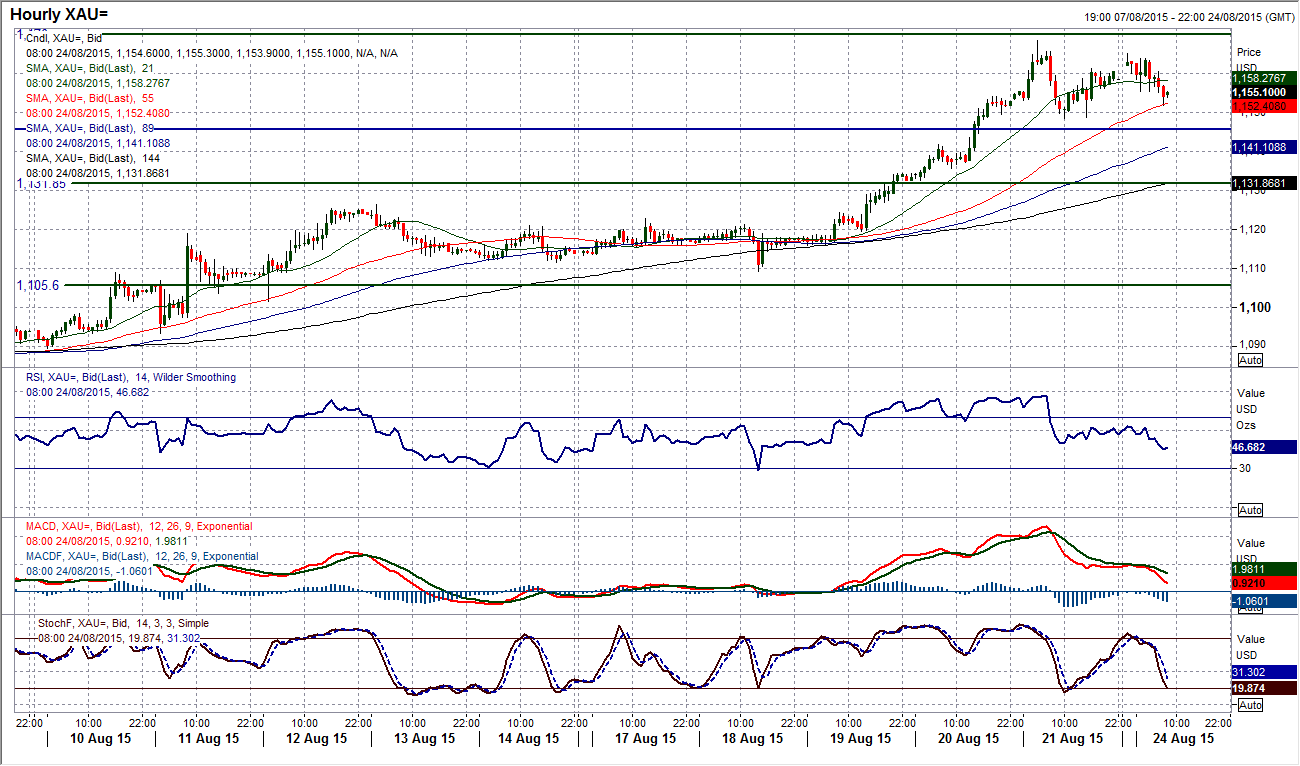
Gold has reached its initial breakout target of $1152 from the bull flag pattern. Then on Friday it came up against the key resistance band $1162/$1170 at which point the rally has begun to stutter. It is interesting that this is happening just as the RSI has reached 70. There is no immediate suggestion that the sellers are returning but this is now perhaps something to be mindful of. Taking a step back, it is interesting that gold is lower on a day when safe havens are still in favour, and this makes me think that it is perhaps a good idea to have profit triggers on long positions not too far away now. The reaction low at $1148.50 on Friday looks like an interesting level as it would complete a small intraday top pattern if broken. This may be a consolidation for gold near term, but it is also happening around a medium term resistance band which has left a high in place at $1168. Hourly momentum has started to fall away slightly too.
WTI Oil
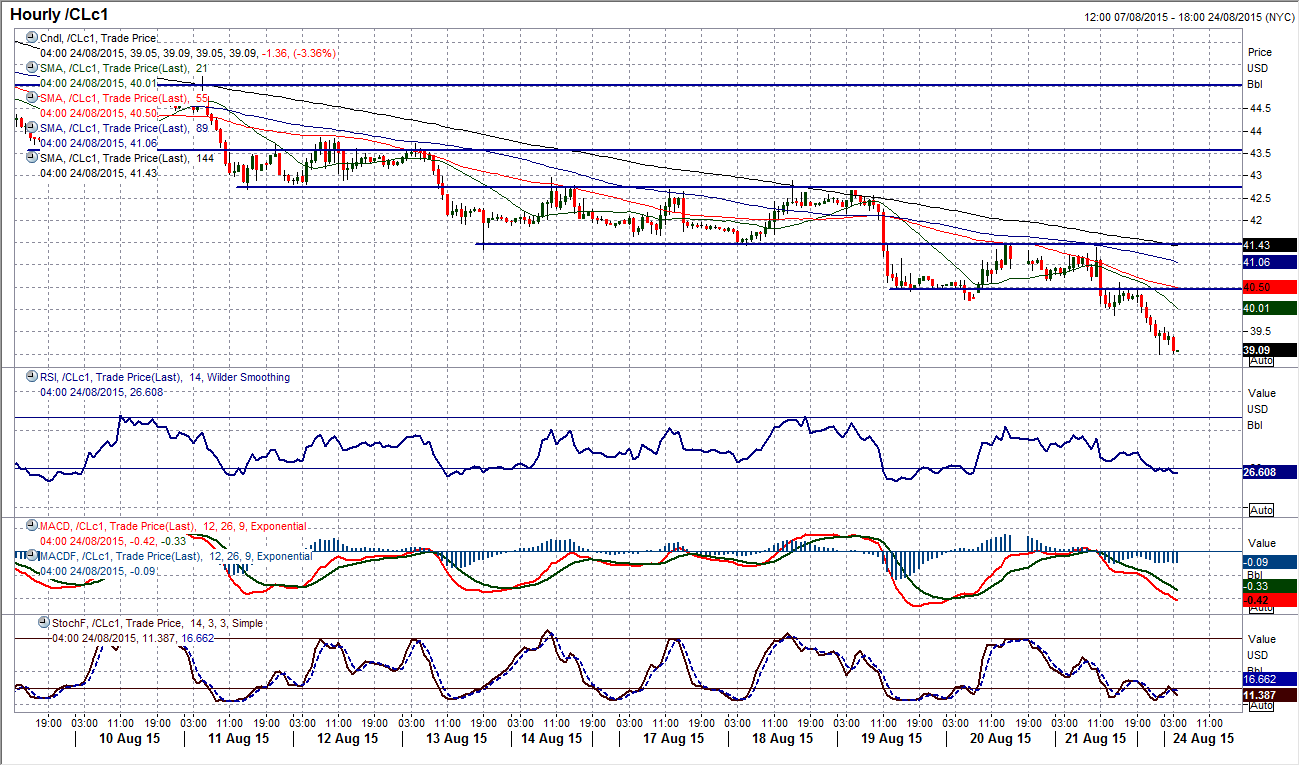
It is difficult to come up with something new to say about WTI when the downtrend is so uniform and adhered to by traders. The $40 level has been the next support that has been breached as WTI shows little sign of stopping the precipitous decline that has seen almost 35% of the price lost in the past 8 weeks. Momentum indicators are showing little sign of any reversal and using the intraday rallies has to remain the only viable strategy. Looking at the hourly chart shows that the latest rally into old support has left resistance at $41.50, whilst if the sequence of old supports becoming new resistances continues then there is now potential for further short positions in the band $40.00/$40.50. Also look at the hourly RSI as a gauge, with moves towards 60 consistently being a level where the bears return. Key near term resistance comes in at $42.75. The next realistic support does not come in until $32.40/$33.55.
Note: All information on this page is subject to change. The use of this website constitutes acceptance of our user agreement. Please read our privacy policy and legal disclaimer. Opinions expressed at FXstreet.com are those of the individual authors and do not necessarily represent the opinion of FXstreet.com or its management. Risk Disclosure: Trading foreign exchange on margin carries a high level of risk, and may not be suitable for all investors. The high degree of leverage can work against you as well as for you. Before deciding to invest in foreign exchange you should carefully consider your investment objectives, level of experience, and risk appetite. The possibility exists that you could sustain a loss of some or all of your initial investment and therefore you should not invest money that you cannot afford to lose. You should be aware of all the risks associated with foreign exchange trading, and seek advice from an independent financial advisor if you have any doubts.
Recommended Content
Editors’ Picks
EUR/USD manages to hold above 200-hour SMA ahead of Eurozone CPI, FOMC

EUR/USD meets with some supply during the Asian session on Tuesday and erodes a part of the previous day's gains amid the emergence of fresh US Dollar buying. Spot prices, however, remain in a familiar range held over the past week or so and currently trade around the 1.0700 round-figure mark.
GBP/USD consolidates its gains above 1.2550, investors await Fed rate decision

GBP/USD consolidates its gains near 1.2560 after flirting with the key 200-day SMA and three-week highs in the 1.2550-1.2560 zone during the early Tuesday. Investors reduce their bets on BoE rate cuts, which support the Cable.
Gold price traders remain on the sidelines ahead of FOMC decision on Wednesday

Gold price remains confined in a narrow range as traders prefer to wait on the sidelines. Reduced Fed rate cut bets revive the USD demand and act as a headwind for the metal. Investors now await the FOMC decision and US macro data before placing directional bets.
BNB price risks a 10% drop as Binance founder and ex-CEO Changpeng Zhao eyes Tuesday sentencing

Binance Coin price is dumping, with the one-day chart showing a defined downtrend. While the broader market continues to bleed, things could get worse for BNB price ahead of Binance executive Changpeng Zhao sentencing on Tuesday, April 30.
Data fuels China optimism

China's factory activity has expanded for a second consecutive month, marking the best streak in over a year and fueling optimism for the sustainability of the world's second-largest economy's recovery.
