Market Overview
Market sentiment is taking a hammering and safe haven flows are on the rise. If the sharp falls on equity markets around the world yesterday were not enough to spook investors, the multi-year low on the Caixin China flash Manufacturing PMI could well be enough to push them over the edge. A reading of 47.1 was well below the already concerning estimate of 48.1 and raises even further worries about the slowdown in China. The impact on global demand from China slowing down has been the story of the summer and commodity prices are being smashed. This is driving traders and investors alike into the safe haven assets. Treasury yields and plummeting, whilst gold, the Japanese yen and Swiss franc are much stronger. Equity markets are taking significant blows, with Wall Street sharply lower overnight (S&P 500 down 2%) which was bad enough but with Asian markets having to also take on board the weak Chin manufacturing data the Nikkei was down 3%. European markets unsurprisingly are sharply lower in early trading.
Forex markets have seen a massive dollar sell-off. Coming in the wake of the dovish Fed minutes on Wednesday, traders have flooded out of the dollar, a move which has continued today. The only saving grace is that the commodity currencies are even weaker as the Aussie, Kiwi and Canadian dollar are all weaker today. The safe haven precious metals are being supported with gold higher, but with the industrial usage element that silver has, it is not faring so well and is only flat today.
Traders have not got a great deal to dispel the malaise today, with the Eurozone flash PMIs only there to distract in the morning. Canadian inflation at 1330BST is expected to be flat on the month, whilst perhaps the US flash manufacturing PMI will give us some respite at 1445BST which is expected to tick slightly higher to 53.9 (from 53.8).
Chart of the Day – USD/CHF
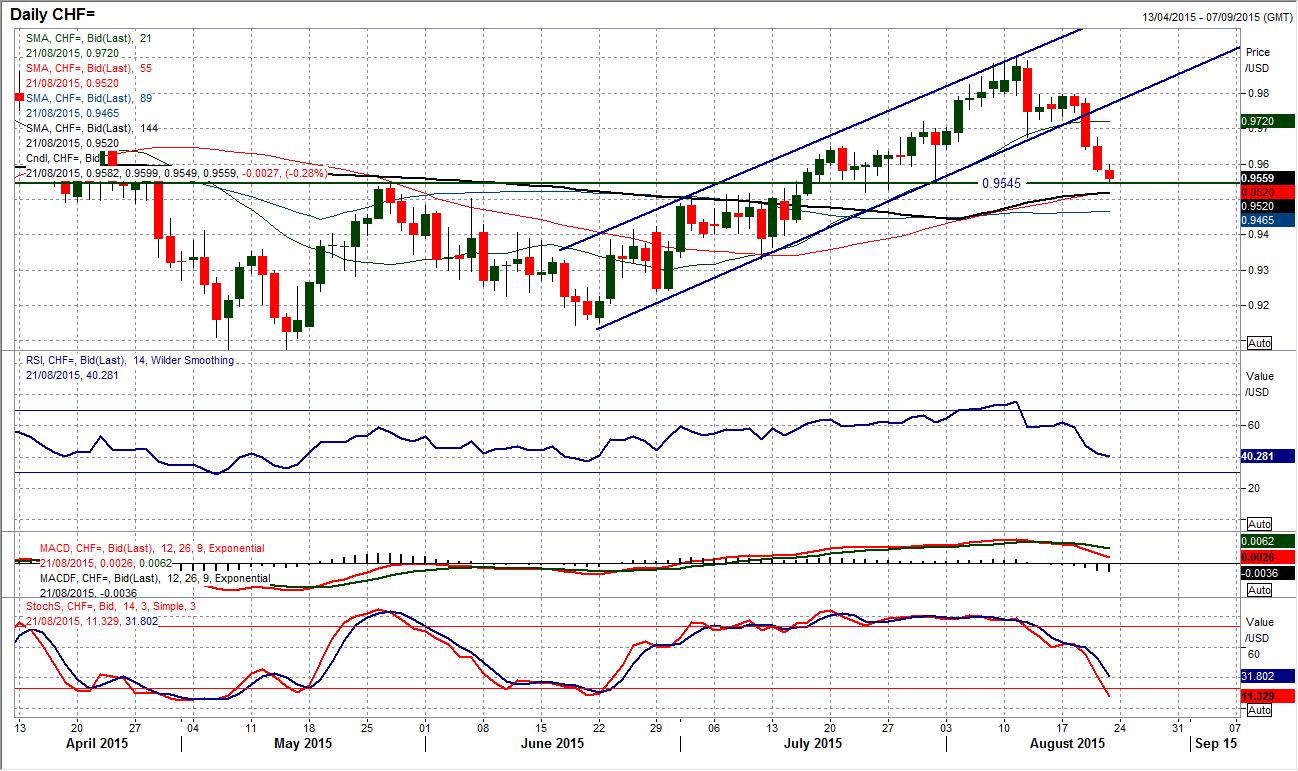
I spoke recently about Dollar/Swiss and how I felt that the uptrend channel was showing signs of strain and with declining momentum could come under corrective pressure. This seems to have been seen, with a closing level on Wednesday below the channel support confirmed yesterday. The sharp breakdown has breached the initial support at 0.9675, and already on the intraday hourly chart it can be seen that this level has become a basis of resistance with a failed retest yesterday. The fact that the daily momentum indicators have all started to deteriorate significantly suggests that rallies should be seen as a chance to sell now as the bearish downside potential is there. The old breakout support at 0.9545 is a key level medium term and this is already being tested today. If the lows from late July between 0.9520/0.9545 are breached then it would open the next key reaction low at 0.9330. The intraday hourly chart now shows an initial band of resistance 0.9610/0.9675 which can be seen as a sell zone for any intraday bounce today.
EUR/USD
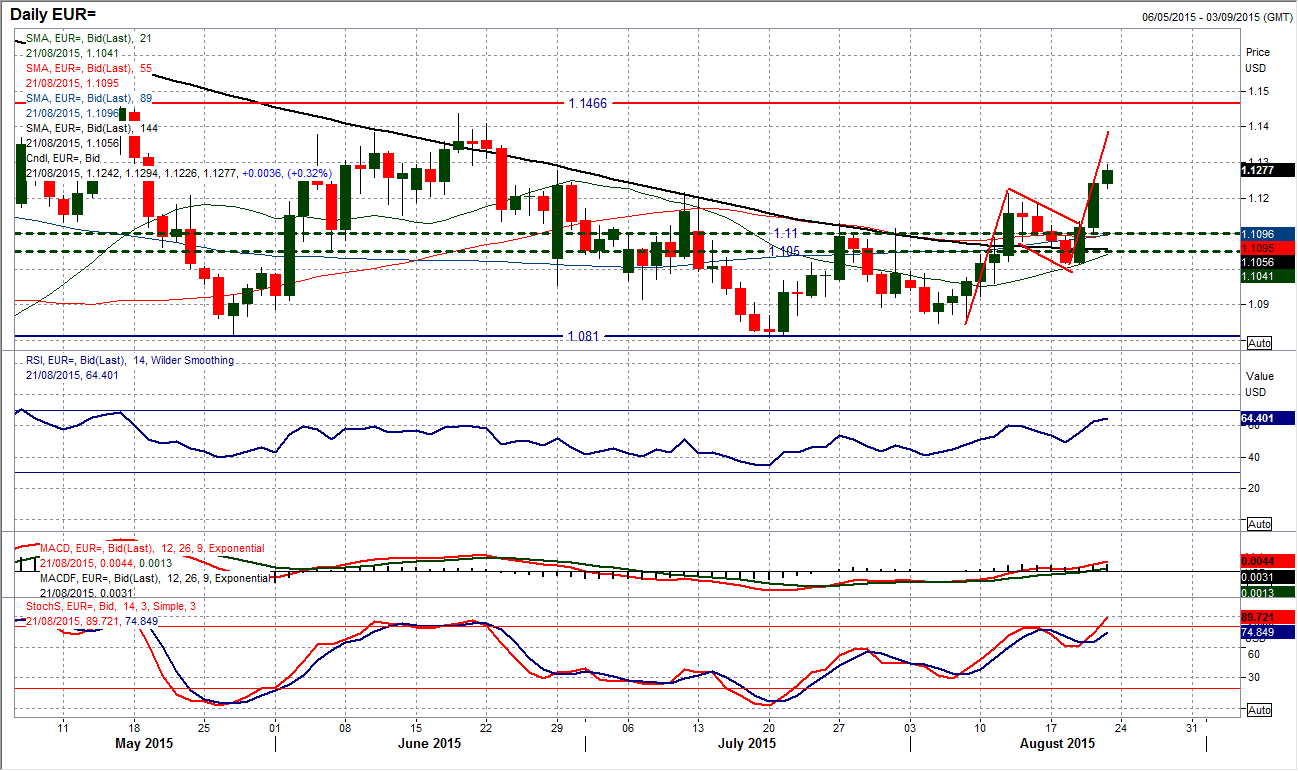
What a move on the euro. The euro bulls (or should that be dollar bears?) have returned with force to see the pair burst higher, through the big resistance at $1.1215 and then continue through the next resistance at $1.1278 too. The move also completed a flag pattern which implies an upside target at $1.1375. The momentum indicators have really gone with the move and certainly for now this is one that should be backed. The RSI is at a 3 month high, with the MACD lines turning more positive and the Stochastics also strongly rising. A closing level above $1.1278 would actually re-open the highs of the big medium term range above $1.1400 again. The intraday hourly cart shows consistent buying in the past day with little turning back. The initial support is now at $1.1215 with the old breakout. Ultimately this is just part of the medium term range playing out and despite the strength of the move, I see it as part of a choppy euro in the coming weeks as the market comes to terms with the likelihood that a Fed September rate hike will not happen.
GBP/USD
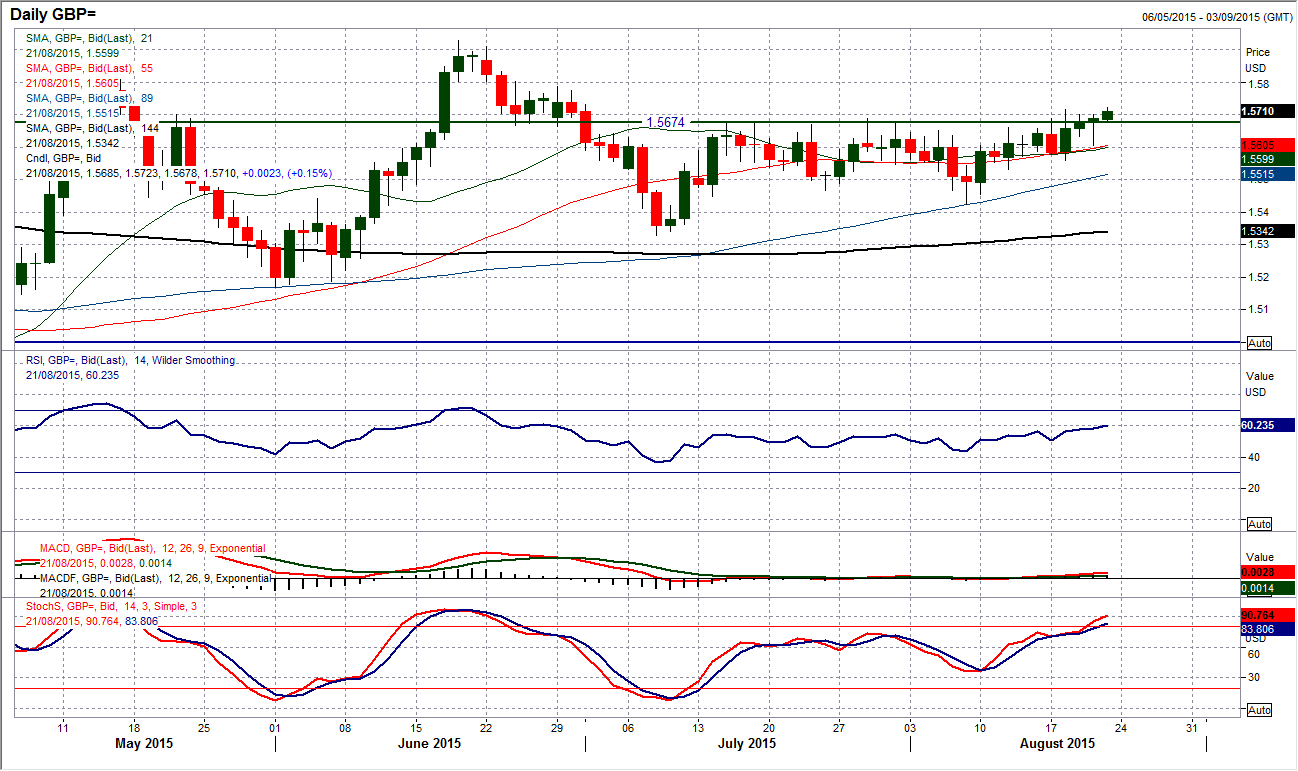
Can Cable now finally make the break? Well yesterday was once more close to a close above $1.5690 but did not quite achieve it. Technical indicators are improving though and the upside pressure continues to mount. I have been looking for the RSI to push consistently above 60 to suggest strong momentum (currently just under), however the Stochastics are now looking strong. So the positive arguments are lining up and the candlestick that was left yesterday with an intraday correction reversing to close at the high of the day is arguably positive (this can be interpreted negatively in some cases as the initial decline is a concern). Looking at the intraday hourly chart is a touch less positive as there is actually little changed from when I wrote my morning report yesterday. The hourly momentum indicators actually continue to suggest a range play. So in a way I am still left wondering about Cable and whether it will break out. Perhaps finally today will be the day. Initial support is the 38.2% Fib level at $1.5646 and then at yesterday’s low at $1.5604. Above $1.5717 opens $1.5787 initially.
USD/JPY
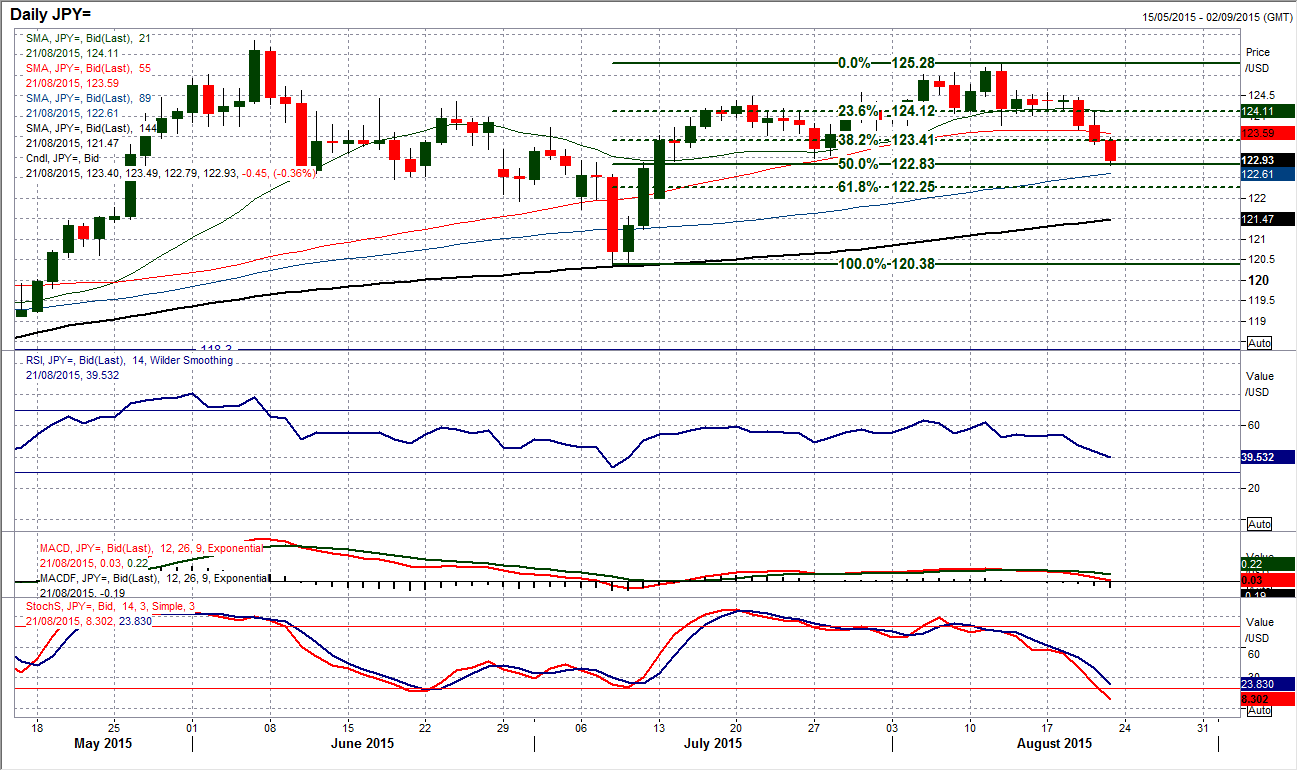
The break lower on Dollar/Yen that I talked about as a possibility yesterday has indeed now happened. The deterioration I the momentum indicators confirms that the yen strengthening (safe haven flows) has dragged the pair lower and with two confirmed bearish candles in a row, the selling pressure is mounting. This has continued into today’s session. My initial downside target of 123.00 from the break below 124.00 has now been more than achieved and it may now be the case that we get some firm direction. The fact that the price has broken so swiftly below the initial support at 123.00 really does suggest that there is some strong momentum behind the move. This opens the potential for a full retracement back to the July low at 120.38. I have drawn in some new Fibonacci retracements of the 120.38/125.28 rally and the initial support now comes in at at 50% retracement at 122.83, which is already acting as a near term buffer. 61.8% is at 122.25. The old breakdown at 123.00 is initial resistance, with 123.30 higher up.
Gold
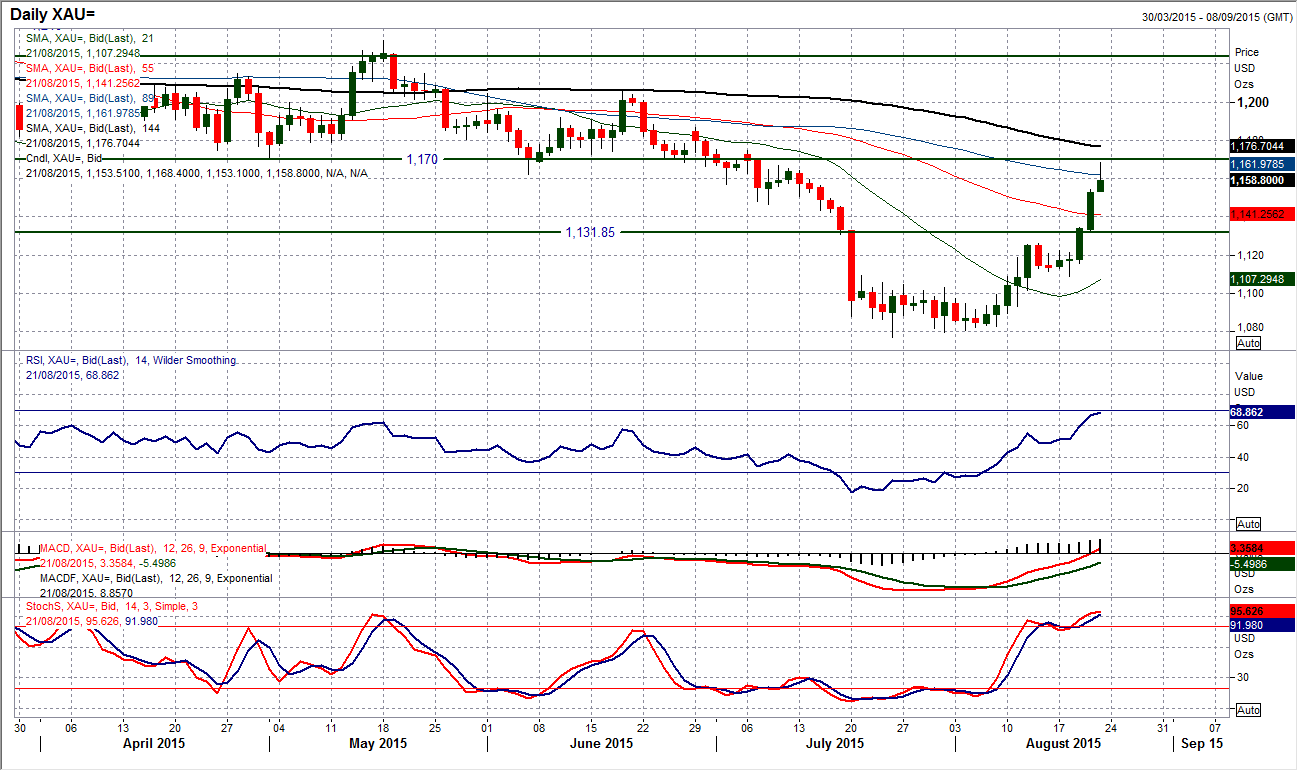
The initial target from the near term bull flag pattern was $1152, but this has been blown out of the water now. A second strong bullish candle completed yesterday and this is being backed up again by a third today. The scope of this bull recovery has been remarkable, adding over $80 to the price in just over 2 weeks. This has unwound gold through all of the near term moving averages and now, remarkably I have to talk about the resistance of the falling 144 day moving average (at $1177) which has been the long term gauge for gold. The rebound is now hitting the resistance band from June in the range between $1162/$1170. Normally I would talk about overhead supply potentially preventing further upside, but right now the bulls are with this one. The momentum is so strong that the RSI is now above 70, whilst the Stochastics are also strong. I said yesterday about riding the rally higher and there is little reason yet to get off it. For short term positions though I would keep stops fairly tight. The intraday hourly chart shows minor support in a $5 range between $1149.40/$1154.40. The rising 21 hour moving average is also a decent gauge of support at $1153.
WTI Oil
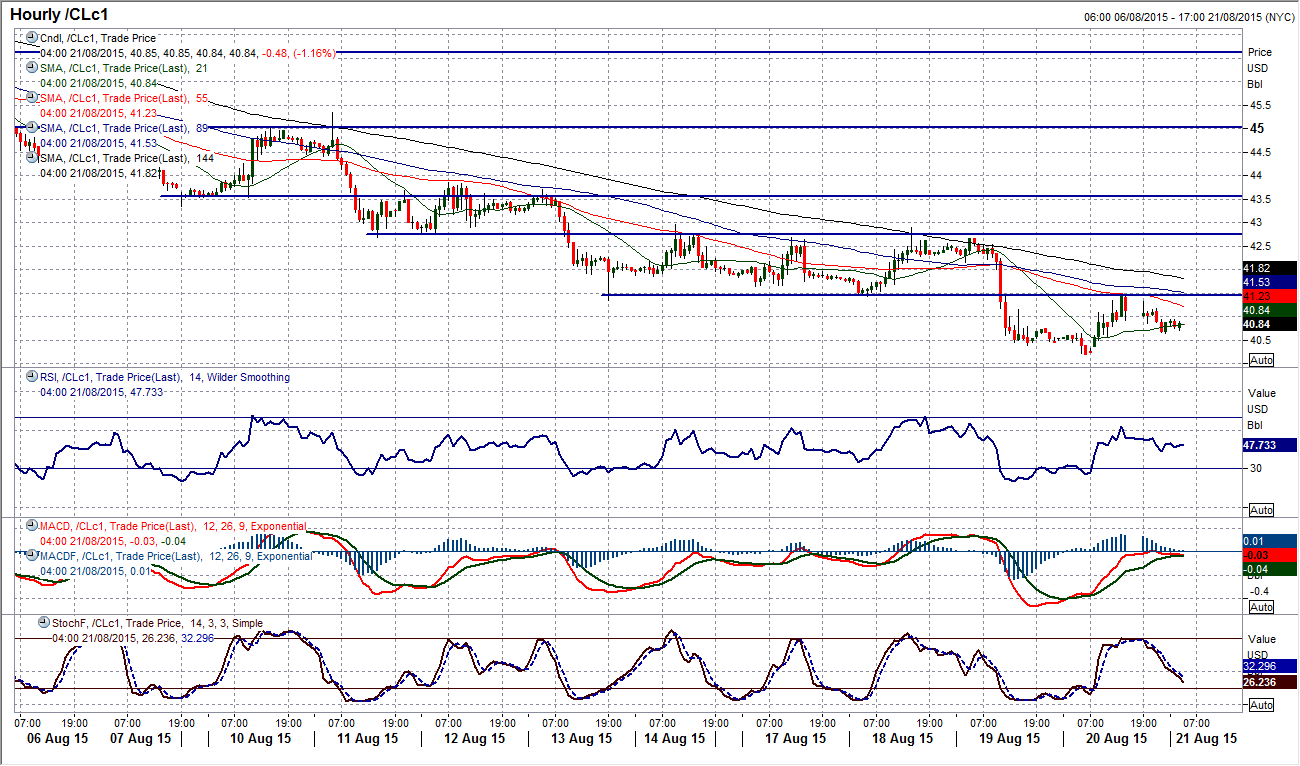
Is another intraday rebound another chance to sell? Certainly if recent history is anything to go by, it certainly should be. Yesterday’s rebound was well within the confines of the 8 week downtrend which now comes in at $41.80 which is below the old key March low at $42.03. A move towards $40 seems to still be on. There is still no sign that the downtrend will be coming to an end (compare with Brent Crude which currently could be in the process of developing a bullish divergence on the RSI). The intraday hourly chart shows the constant selling of rallies at old levels of support, with the latest at $41.50. However, even if this level is broken, the key resistance comes in around $42.75 and until this level is breached then any rallies will not be trusted. Yesterday’s low at $40.20 is likely to give little protection from a test of $40. Beyond $40 and we have to start thinking about the December 2008/February 2009 lows at $32.40/$33.50.
Note: All information on this page is subject to change. The use of this website constitutes acceptance of our user agreement. Please read our privacy policy and legal disclaimer. Opinions expressed at FXstreet.com are those of the individual authors and do not necessarily represent the opinion of FXstreet.com or its management. Risk Disclosure: Trading foreign exchange on margin carries a high level of risk, and may not be suitable for all investors. The high degree of leverage can work against you as well as for you. Before deciding to invest in foreign exchange you should carefully consider your investment objectives, level of experience, and risk appetite. The possibility exists that you could sustain a loss of some or all of your initial investment and therefore you should not invest money that you cannot afford to lose. You should be aware of all the risks associated with foreign exchange trading, and seek advice from an independent financial advisor if you have any doubts.
Recommended Content
Editors’ Picks
EUR/USD edges lower toward 1.0700 post-US PCE

EUR/USD stays under modest bearish pressure but manages to hold above 1.0700 in the American session on Friday. The US Dollar (USD) gathers strength against its rivals after the stronger-than-forecast PCE inflation data, not allowing the pair to gain traction.
GBP/USD retreats to 1.2500 on renewed USD strength

GBP/USD lost its traction and turned negative on the day near 1.2500. Following the stronger-than-expected PCE inflation readings from the US, the USD stays resilient and makes it difficult for the pair to gather recovery momentum.
Gold struggles to hold above $2,350 following US inflation

Gold turned south and declined toward $2,340, erasing a large portion of its daily gains, as the USD benefited from PCE inflation data. The benchmark 10-year US yield, however, stays in negative territory and helps XAU/USD limit its losses.
Bitcoin Weekly Forecast: BTC’s next breakout could propel it to $80,000 Premium

Bitcoin’s recent price consolidation could be nearing its end as technical indicators and on-chain metrics suggest a potential upward breakout. However, this move would not be straightforward and could punish impatient investors.
Week ahead – Hawkish risk as Fed and NFP on tap, Eurozone data eyed too

Fed meets on Wednesday as US inflation stays elevated. Will Friday’s jobs report bring relief or more angst for the markets? Eurozone flash GDP and CPI numbers in focus for the Euro.
