Market Overview
With US data continuing to disappoint, the expectations for Fed rate tightening are being pushed back. This is beginning to see a negative drift on Treasury yields which is resulting in support for the US dollar with Wall Street able to drag itself to another new all-time closing high. Markets are still therefore running off the US data and movement in Treasury yields. With little on the economic calendar to drive today (other than a little housing data), today could be a technically driven trading day.
The lacklustre session on Wall Street did little to inspire confidence in the rally. Equities pushed higher as the disappointing US industrial and consumer data would have given the Fed little excuse to hike rates and this lower for longer argument has dragged the S&P 500 higher by just 0.1%. Asian markets were still positive though this morning with the Nikkei up 0.8%. European markets are also mildly higher on Monday morning.
In forex markets there is a cautious look to trading movement across the board, with no real standout performances. Gold and silver have both begun the week in positive mood with gold pushing higher with its breakout.
There is little to capture the imagination today with the economic calendar rather bare. The only real movement could come from the National Association of Home Buyers Index at 1500BST which is expected to improve very slightly from 56 to 57.
Chart of the Day – EUR/JPY
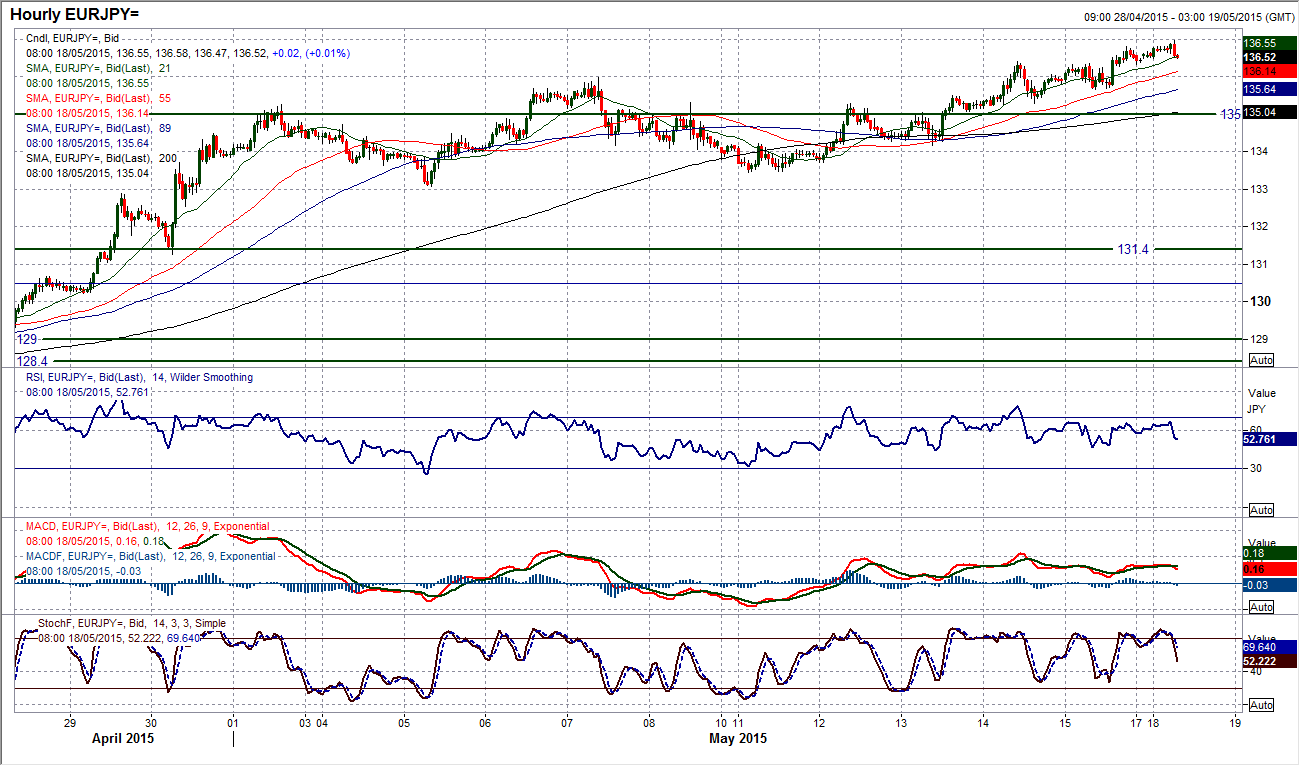
The recovery in EUR/JPY continues and is today breaking through the latest resistance of the February high at 136.68. This suggests that the bulls are now on the brink of a really significant breakout. A move above the 144 day moving average (at 137.16). This would be the first time in 4 months the price would have been trading above the long term indicators and would be a signal of longer term improvement. The daily momentum indicators are already calling the key breakout with the RSI bullishly around 70, the highest in 2015; the MACD similarly at a 2015 high and the Stochastics also in bullish configuration. The hourly chart shows a very positive set up over the past week, with a series of higher lows and higher highs. The old breakout resistance band now turned supportive between 136.00/136.70. Hourly momentum indicators are also now in bullish configuration and corrections are being used as a chance to buy. A latest higher low around 136.00 would be ideal, but even if there were to be a dip back towards the old key pivot level at 135.00 this would still be a buying opportunity. Support at 134.17 is key, but the major near term support is at 133.43.
EUR/USD
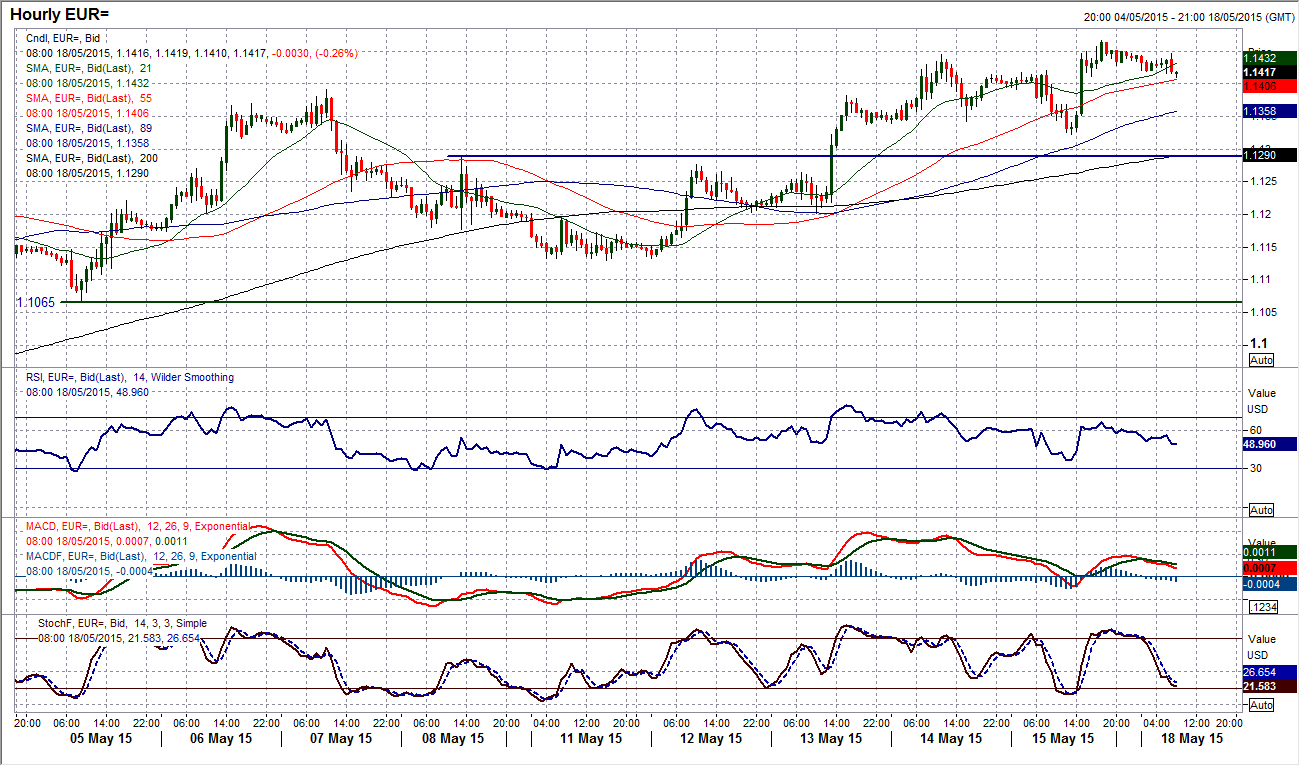
The euro rally continued higher on Friday and it is now up to challenge the next resistance band that starts at $1.1450 up to $1.1530. The bulls looked strong also with the posting of a bullish outside day. The momentum indicators remain strong, although there is a slight sense that up around the resistance and the daily RSI towards 70 there may be a limited upside potential. This is also a feeling I get when I look at the intraday hourly chart which shows the push higher on Friday on the price was not mirrored on the hourly momentum indicators. These slight bearish divergences could again be a part of a slowing of momentum. The support of Friday’s low at $1.1323 now becomes an important first test as a loss of this low could induce a near term correction. For now I cautiously back this bull run as I am aware that a correction could be looming.
GBP/USD
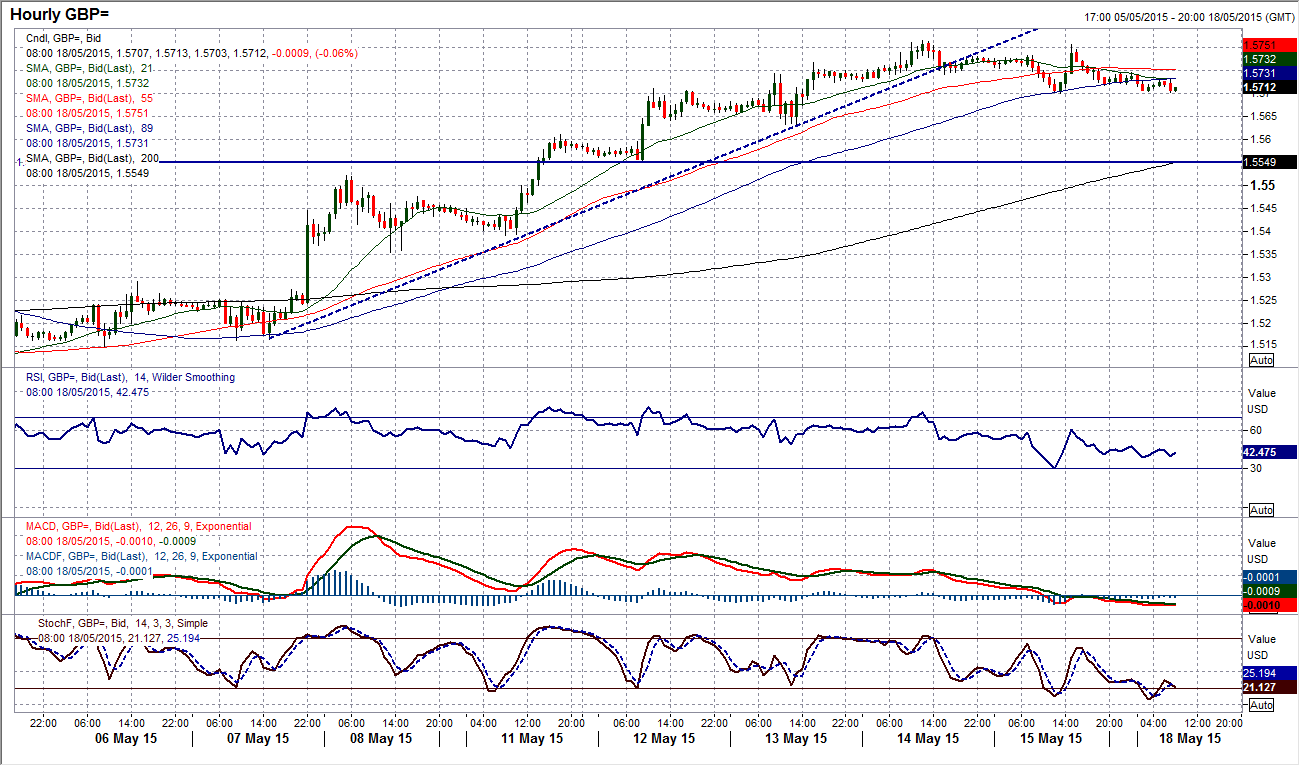
I mentioned towards the back end of last week that I felt concerned that a few corrective signals were beginning to show through and that the bull run may be ready for a correction near term. The bearish candle on Friday was the first in eight sessions and with momentum just rolling over slightly the bulls have just lost control now for the time being. If the corrective pressure do drag the price lower I am of the opinion that it would be part of the pullback to the neckline of the large base pattern around $1.5550 which has yet to be seen. The intraday hourly chart shows the broken 5 day uptrend, moving averages rolling over and hourly momentum in decline. There is minor support at $1.5700 but the reaction low at $1.5630 is important now near term. The resistance in place at $1.5814 is holding back the bulls now from further test of the $1.5835 reaction high.
USD/JPY
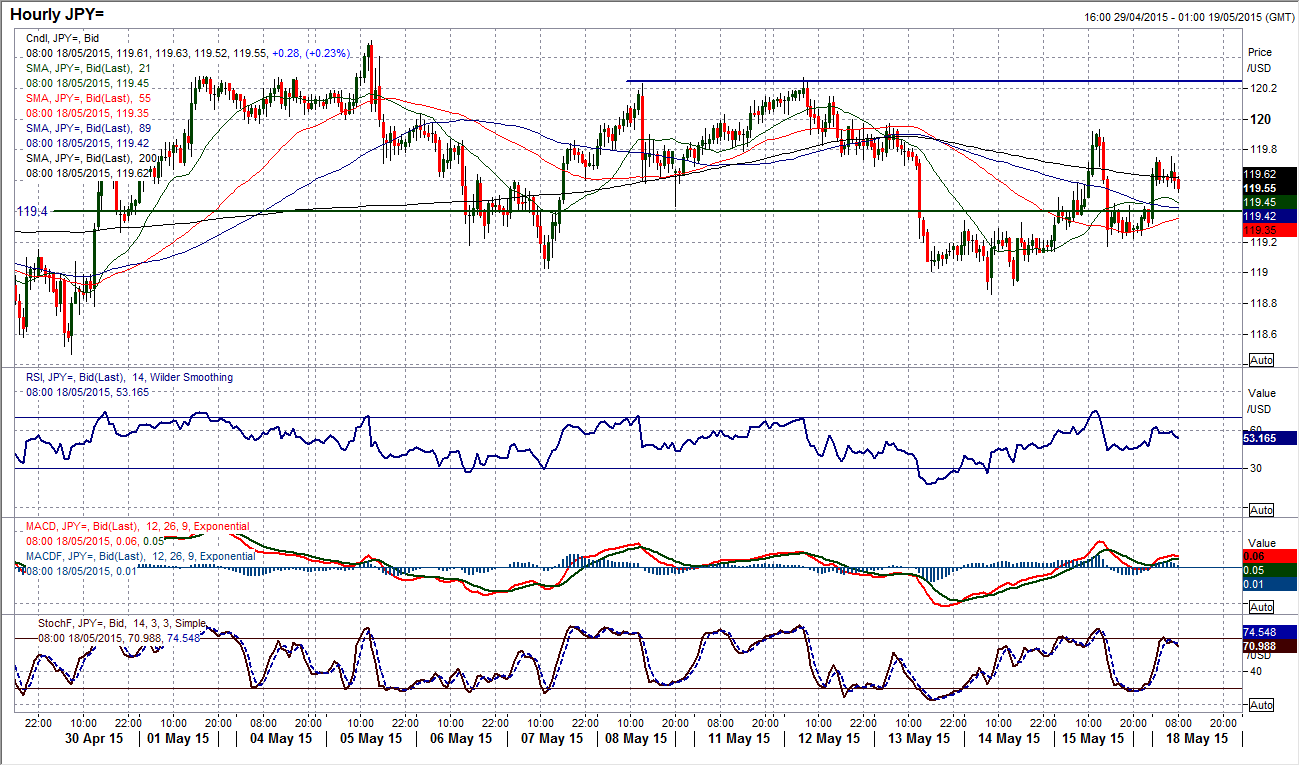
Perhaps the most interesting aspect of the Dollar/Yen chart is the lack of decisive movement. Whilst the dollar has been under significant and often volatile selling pressure against other major currencies, the yen is broadly flat and has been so for at least two months, stuck in the 118.30/120.85 range. Daily momentum indicators remain very neutral and are not showing any sign of a breaking of the range. SO we must look to play this pair on a very short term basis. The extreme RSI signals on the hourly chart is one way, so latterly a move towards 70 would give a selling opportunity. There is resistance in place at just under 120.00, and then at 120.27 and 120.50. The pivot around 119.40 is no longer as effective as it has been previously but is still a level to work around. Support is now in at 119.20 and then 118.86.
Gold
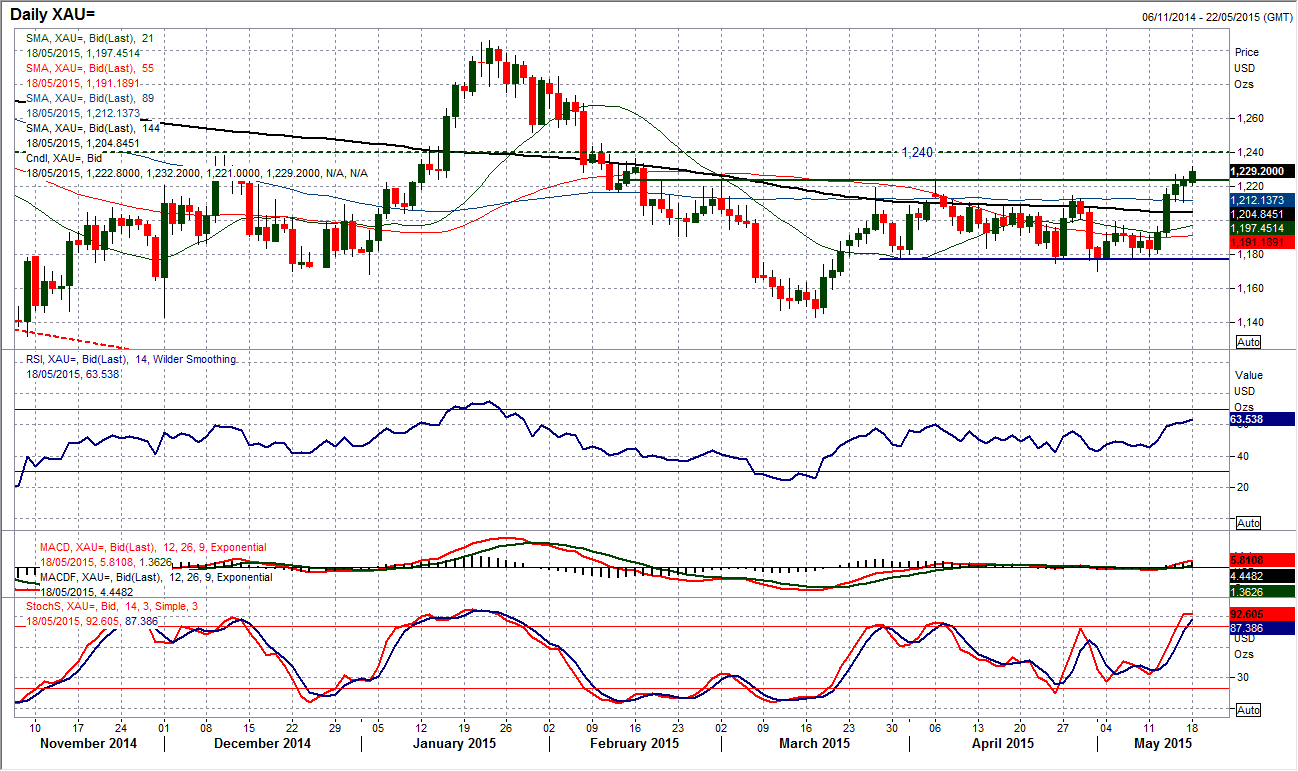
Is it possible that finally the gold price is now beginning to get some traction and there is going to be a breaking higher from the range? After four straight days of gains, the bulls are putting real pressure on the old resistance at $1224.10. I continue to look for a closing break above the resistance to give confirmation of the intraday breaches that have been achieved on recent days but without that final confirmation break. Once more we are seeing an intraday breach with this morning a push to a new 3 month high. The momentum signals are beginning to add to the breakout with the RSI now above 60 and at its highest since late January. A test of the resistance at $1236.50 is next up. A successful confirmed upside breakout from the range could imply an upside target of $1270. There is now good support in place at $1211, with $1221 the initial support.
WTI Oil
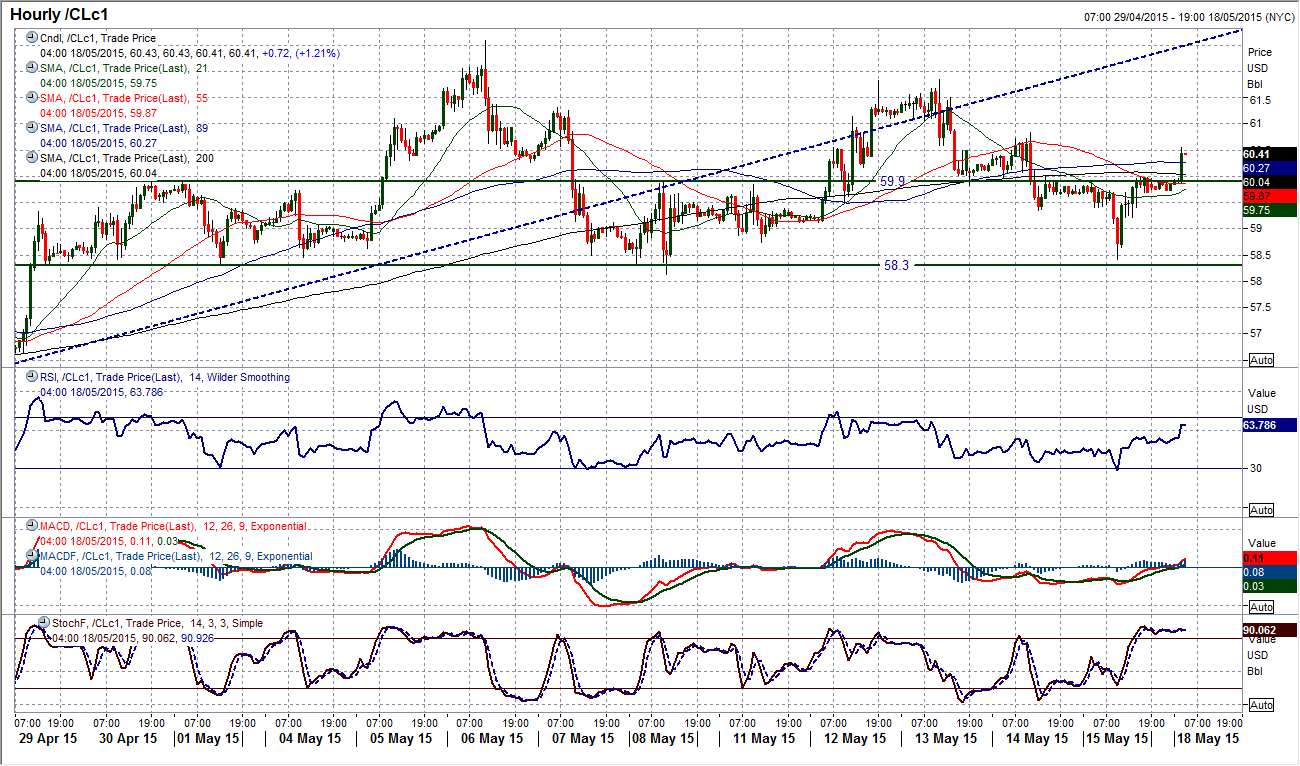
I have become cautious on the WTI rally in the past few days and once more, on Friday the price action gives me justification. The corrective influences on the daily chart have broken the rally uptrend, whilst the momentum indicators are now beginning to roll over. The MACD lines have bearishly crossed, whilst the Stochastics have also deteriorated. The hourly chart shows the importance of the support around $58.30 coming into play once more on Friday. This support marks an important potential neckline of a top pattern that would imply a correction back towards $54.00 if it was broken on a daily closing basis. It is important not to call patterns before they complete so for now this could just be a range play below the recent peak at $62.58. However if the daily momentum indicators continue to deteriorate then the bears will be eyeing an opportunity. The old resistance level at $59.90 is becoming an interesting pivot level near term.
Note: All information on this page is subject to change. The use of this website constitutes acceptance of our user agreement. Please read our privacy policy and legal disclaimer. Opinions expressed at FXstreet.com are those of the individual authors and do not necessarily represent the opinion of FXstreet.com or its management. Risk Disclosure: Trading foreign exchange on margin carries a high level of risk, and may not be suitable for all investors. The high degree of leverage can work against you as well as for you. Before deciding to invest in foreign exchange you should carefully consider your investment objectives, level of experience, and risk appetite. The possibility exists that you could sustain a loss of some or all of your initial investment and therefore you should not invest money that you cannot afford to lose. You should be aware of all the risks associated with foreign exchange trading, and seek advice from an independent financial advisor if you have any doubts.
Recommended Content
Editors’ Picks
EUR/USD edges lower toward 1.0700 post-US PCE

EUR/USD stays under modest bearish pressure but manages to hold above 1.0700 in the American session on Friday. The US Dollar (USD) gathers strength against its rivals after the stronger-than-forecast PCE inflation data, not allowing the pair to gain traction.
GBP/USD retreats to 1.2500 on renewed USD strength

GBP/USD lost its traction and turned negative on the day near 1.2500. Following the stronger-than-expected PCE inflation readings from the US, the USD stays resilient and makes it difficult for the pair to gather recovery momentum.
Gold struggles to hold above $2,350 following US inflation

Gold turned south and declined toward $2,340, erasing a large portion of its daily gains, as the USD benefited from PCE inflation data. The benchmark 10-year US yield, however, stays in negative territory and helps XAU/USD limit its losses.
Bitcoin Weekly Forecast: BTC’s next breakout could propel it to $80,000 Premium

Bitcoin’s recent price consolidation could be nearing its end as technical indicators and on-chain metrics suggest a potential upward breakout. However, this move would not be straightforward and could punish impatient investors.
Week ahead – Hawkish risk as Fed and NFP on tap, Eurozone data eyed too

Fed meets on Wednesday as US inflation stays elevated. Will Friday’s jobs report bring relief or more angst for the markets? Eurozone flash GDP and CPI numbers in focus for the Euro.
