Market Overview
Looking across the charts, in the past day or so the outlook on many forex pairs, gold and even some of the indices has become fairly settled. The US dollar is still unable to muster a confirmed breakout of the recent range (although once again it is building today). This is leaving key forex pairs such as GBP/USD and USD/JPY increasingly range bound, whilst gold and silver are also rather settled. The outlook on Wall Street continues to remain positive and the S&P 500 has managed to edge another 0.3% higher. Asian markets are trading mixed overnight whilst European indices are mildly positive in early trading today.
There is a sense that maybe traders are waiting for something, the next catalyst. Perhaps it will be the crucial OPEC meeting on Thursday. Or it could be today, with the key US data of the week released. At 13:30GMT the preliminary GDP (second reading) for Q3 in the US is released. The expectation is that there will be a slight slide from the original from 3.5% to 3.3% annualised. There is also the Case-Shiller housing data released at 14:00GMT which today with could play a role, whilst at 15:00GMT the Conference Board’s Consumer Confidence data is released. Confidence has been growing steadily throughout 2014 and is expected to continue the trend and move to 96.0 (from 94.5).
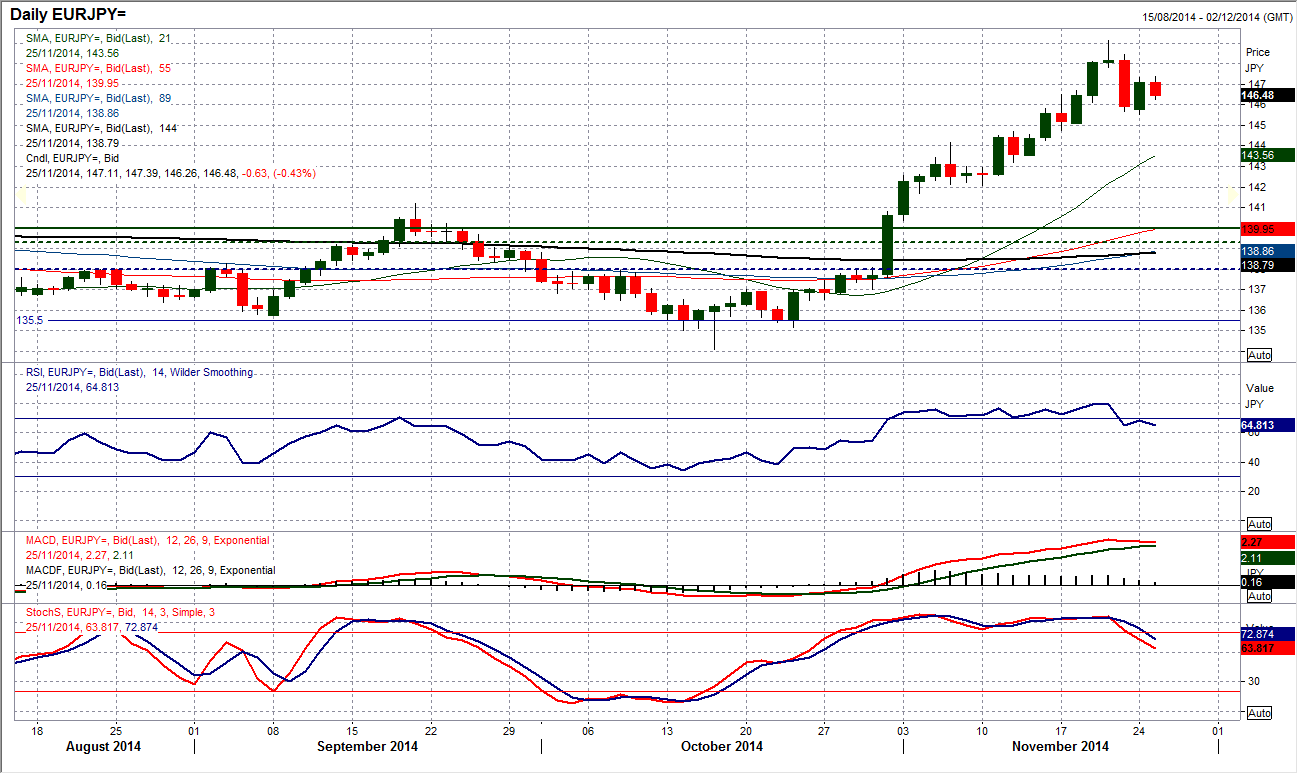
Chart of the Day – EUR/JPY
The outlook has become increasingly choppy in the past few days, however there seems to be a developing prospect of a reversal. Last Thursday there was a weak candle that could almost be described as a shooting star (although not quite as bearish) which was then followed by a sharply negative candle which completed arguably an “evening star” bearish candlestick formation. During this time the RSI has crossed back below 70, whilst the Stochastics have given a confirmed crossover sell signal. This would suggest the negative signals are all building up now. The intraday hourly chart shows nothing overtly bearish, however with yesterday’s rebound falling over around a minor resistance at 147.40, if the price now retreats to fall below yesterday’s low at 145.55 then the correction will be gathering pace. With the corrective indicators now being seen it would need a move above the recent high at 149.12 to suggest the bulls can be sure again.
EUR/USD
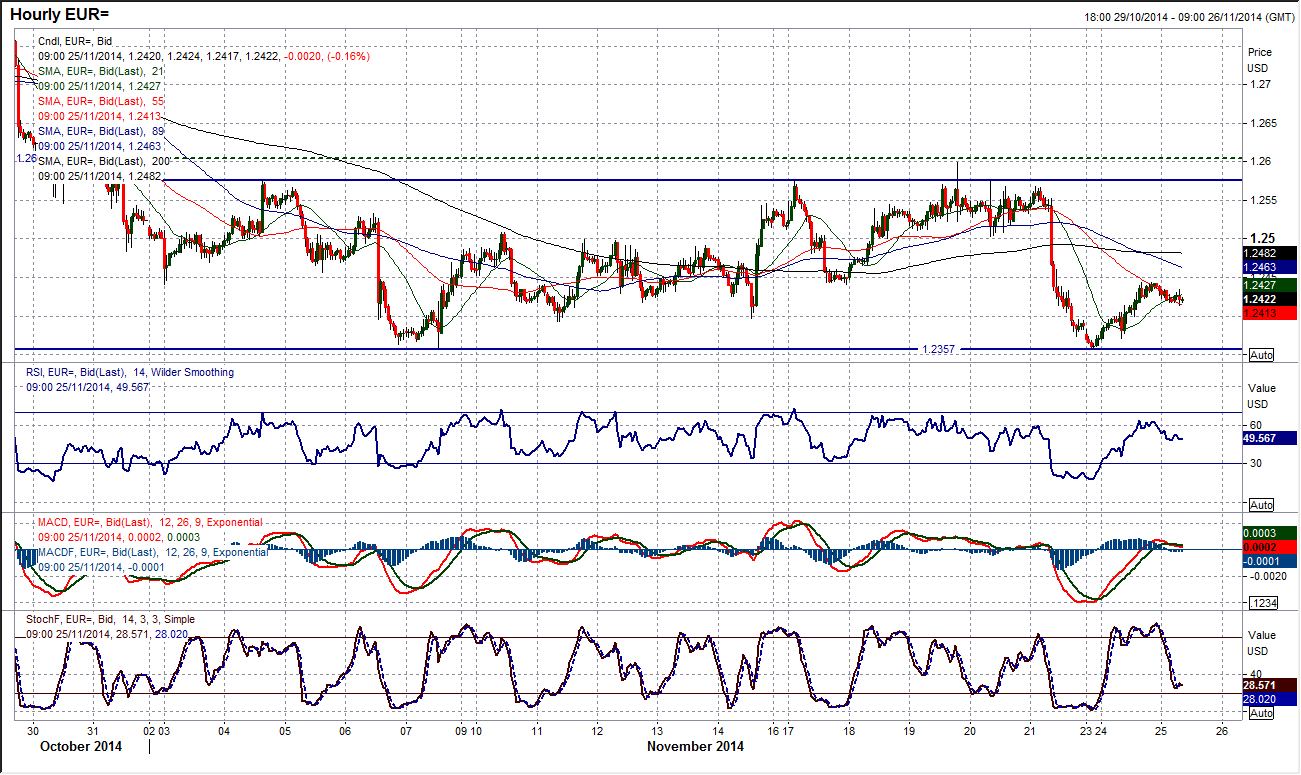
The euro managed to unwind some of Friday’s weakness yesterday but it merely looks to once more be a case of renewing the downside pressure. The key low at $1.2357 was hit to the pip before the rally set in, with the move unwinding back towards the initial resistance at $1.2440 and then rolling over. The technical indicators on the intraday hourly chart suggest that this is just another rally that has given a chance to sell. The hourly RSI has failed to get back above 65 before falling over, whilst the MACD lines have also rolled over around neutral. The daily chart suggests that the euro may be rangebound for now, but the medium term outlook remains negative and a downside break looks to be approaching. Maybe this rebound that has hit resistance mid-range will be the catalyst. There is further resistance around $1.2500 and then $1.2577.
GBP/USD
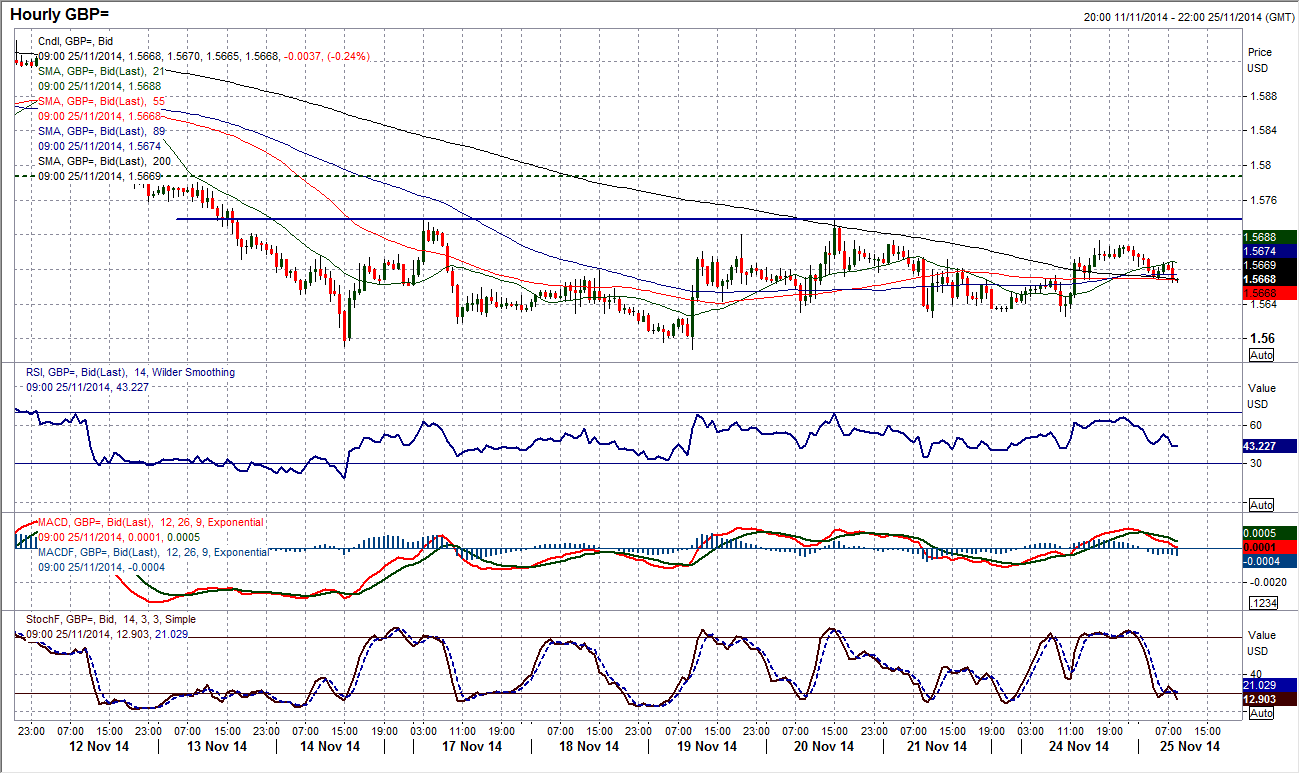
Cable continues to consolidate and is going through a rather quiet phase pf trading. The rate is currently trading in a 150 pip band between $1.5588 and $1.5736 and showing little indication of which way it will break. With trends and moving averages all negative, the daily momentum indicators all remain in bearish configuration and suggest that the next break will once more be to the downside. The intraday hourly chart suggests an increasingly neutral picture with little steer from a flat series of hourly moving averages and neutral looking hourly momentum indicators. The last three days has seen a floor in the price at $1.5630, whilst yesterday’s high at $1.5715 is also a barrier. A breach of either of these levels could be a precursor to a range break.
USD/JPY
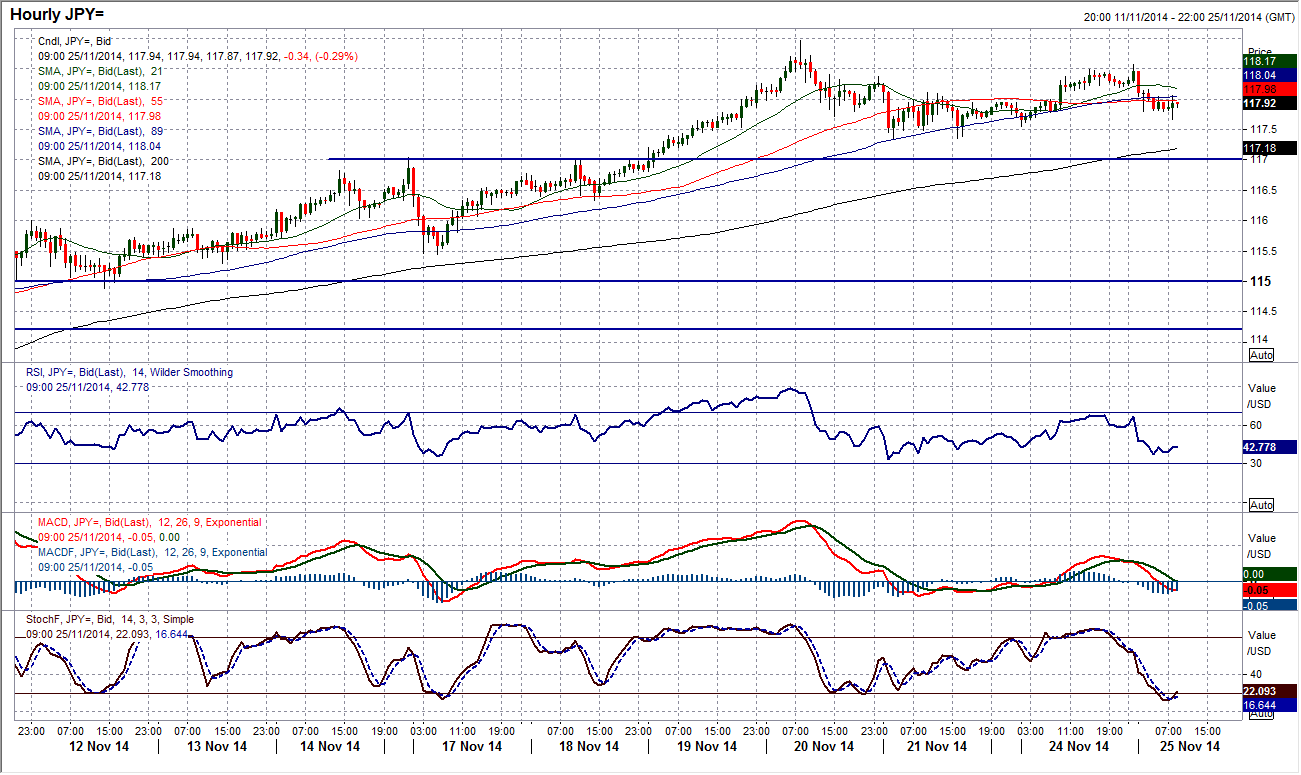
After almost incessant one way traffic the yen is beginning to find its feet a little. This is beginning to show through on both the daily and hourly charts as a consolidation that is building. The fact that this is happening after the rate came within 11 pips of the 161.8% Fibonacci projection target of 119.07 is also interesting. Calling tops before they set in can often be a rookie mistake, because “the trend is your friend” until it its broken. Therefore we should not get too worked up until the reaction low at 117.33 is breached, and then ideally the support at 117.00. For now this must simply be treated as a consolidation pattern waiting for the next signal. The key resistance remains 118.96.
Gold
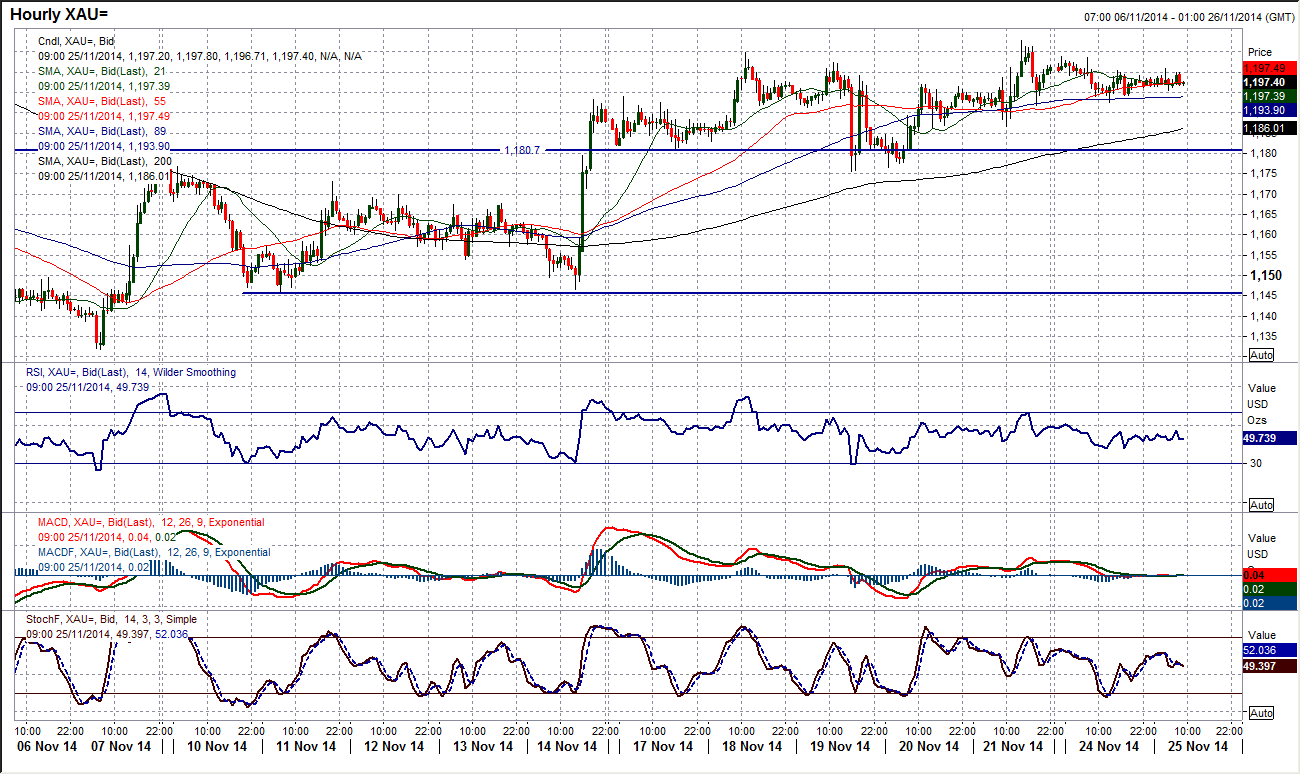
Having broken out above $1180, the gold price is settling down to trade around $1200. This unfortunately can be taken two ways. Firstly, a failure to continue the rally, with the momentum indicators just beginning to lose the upside impetus around levels that would suggest the medium term picture has just unwound an oversold position. Or simply just a pause for breath within the recovery which has broken out above $1180 and since used this as a support area. The consolidation has turned the hourly intraday chart increasingly neutral and it seems as though gold is awaiting the next catalyst. Perhaps this is not so surprising with a huge fundamental event at the end of the week (the Swiss Gold referendum is on Sunday). For now resistance is at $1207.70, above which opens $1221.70. Support is $1186.64.
WTI Oil
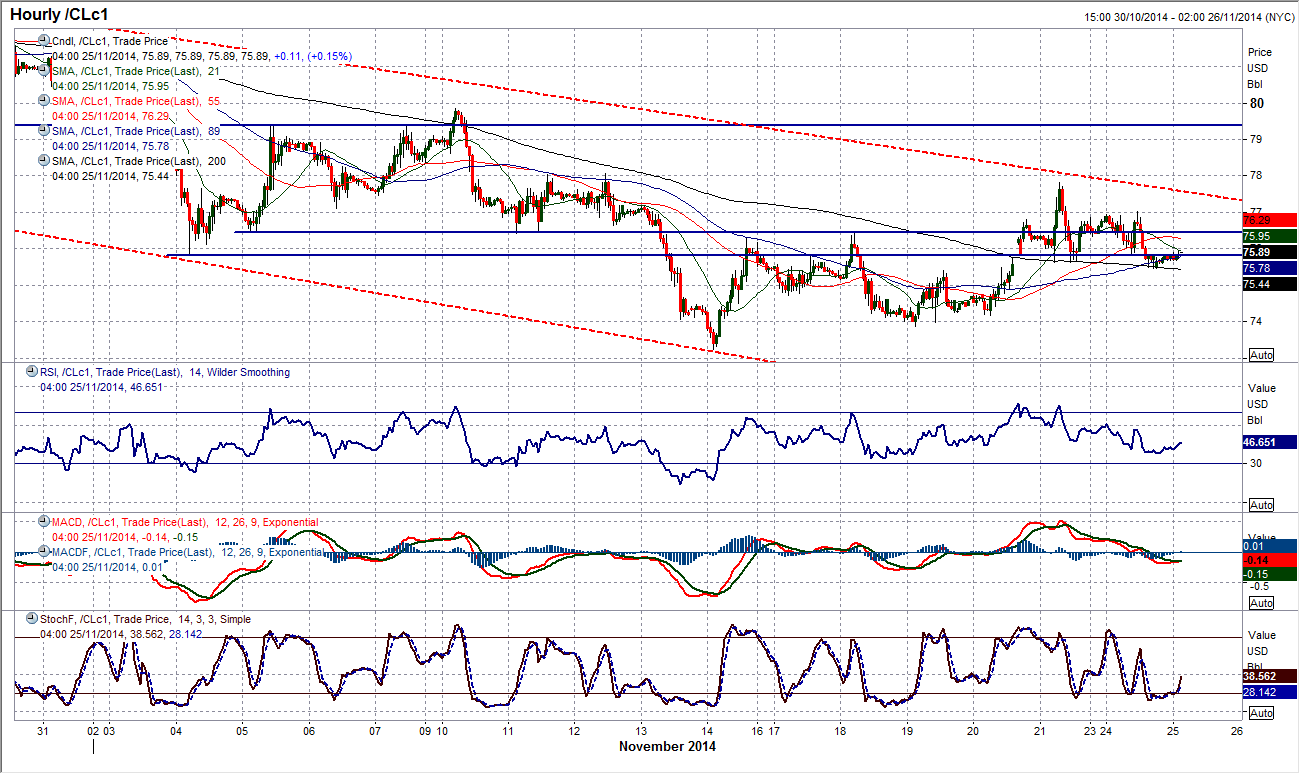
Although the WTI price continues to trade within the 5 week downtrend channel there has been a subtle shift in outlook in the past couple of days. Having broken below the support band $75.85/$76.40 last week the price has since broken back above that old band and is once more looking to use it as the basis of support again. The medium term outlook remains under pressure with the key resistance around $80 intact, but the bulls will be eying the top of the downtrend channel which currently comes in around $77.50. Furthermore, there are slight signs that momentum indicators are beginning to improve, with both the RSI and Stochastics at a 7 week high. This suggests that perhaps the outlook of selling into strength should be put on ice for the immediate term. It is difficult to ascertain the price movement in front of the crucial OPEC meeting, but the technical outlook is showing signs of improvement. Friday’s high at $77.83 is the immediate resistance now.
Note: All information on this page is subject to change. The use of this website constitutes acceptance of our user agreement. Please read our privacy policy and legal disclaimer. Opinions expressed at FXstreet.com are those of the individual authors and do not necessarily represent the opinion of FXstreet.com or its management. Risk Disclosure: Trading foreign exchange on margin carries a high level of risk, and may not be suitable for all investors. The high degree of leverage can work against you as well as for you. Before deciding to invest in foreign exchange you should carefully consider your investment objectives, level of experience, and risk appetite. The possibility exists that you could sustain a loss of some or all of your initial investment and therefore you should not invest money that you cannot afford to lose. You should be aware of all the risks associated with foreign exchange trading, and seek advice from an independent financial advisor if you have any doubts.
Recommended Content
Editors’ Picks
EUR/USD edges lower toward 1.0700 post-US PCE

EUR/USD stays under modest bearish pressure but manages to hold above 1.0700 in the American session on Friday. The US Dollar (USD) gathers strength against its rivals after the stronger-than-forecast PCE inflation data, not allowing the pair to gain traction.
GBP/USD retreats to 1.2500 on renewed USD strength

GBP/USD lost its traction and turned negative on the day near 1.2500. Following the stronger-than-expected PCE inflation readings from the US, the USD stays resilient and makes it difficult for the pair to gather recovery momentum.
Gold struggles to hold above $2,350 following US inflation

Gold turned south and declined toward $2,340, erasing a large portion of its daily gains, as the USD benefited from PCE inflation data. The benchmark 10-year US yield, however, stays in negative territory and helps XAU/USD limit its losses.
Bitcoin Weekly Forecast: BTC’s next breakout could propel it to $80,000 Premium

Bitcoin’s recent price consolidation could be nearing its end as technical indicators and on-chain metrics suggest a potential upward breakout. However, this move would not be straightforward and could punish impatient investors.
Week ahead – Hawkish risk as Fed and NFP on tap, Eurozone data eyed too

Fed meets on Wednesday as US inflation stays elevated. Will Friday’s jobs report bring relief or more angst for the markets? Eurozone flash GDP and CPI numbers in focus for the Euro.
