Cycle Trading: Weekend Report Preview

The Dollar
The bearish reversal on Tuesday followed by closing below the 50 day MA on Thursday confirms the daily cycle decline.
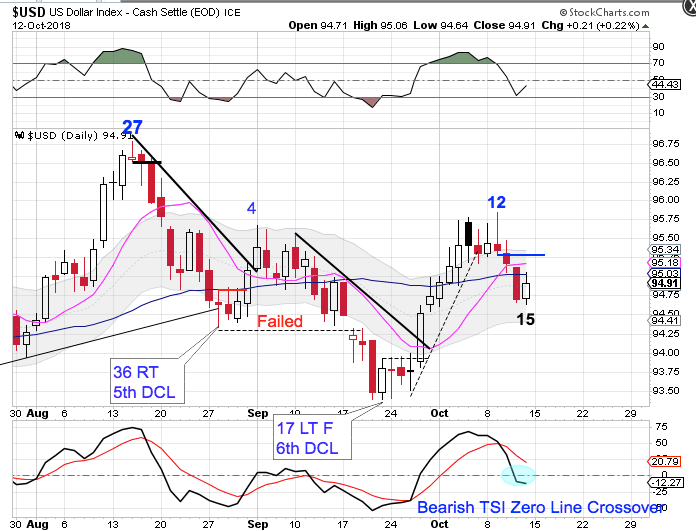
The dollar peaked on day 12 and printed its lowest point on Wednesday, day 15. Since 25 out of the last 30 daily cycles stretched 24 days or longer, a peak on day 12 can still result in a left translated daily cycle formation. The dollar still needs to turn the 10 day MA lower before we can expect a DCL to form. Currently the dollar is in a daily uptrend. A close below the lower daily cycle band will end the daily uptrend and begin a daily downtrend.
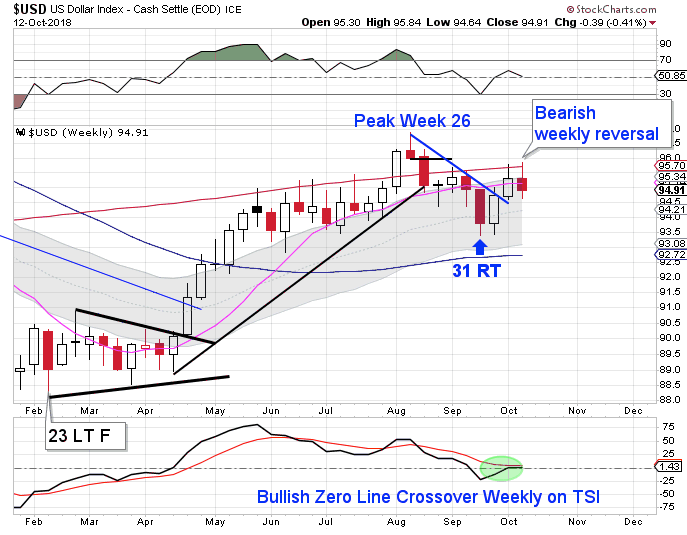
The dollar printed a bearish weekly reversal back in August and lost the 200 month MA. The dollar is in week 3 of its new intermediate cycle and it appears that the dollar has been rejected by the 200 month MA which has caused the dollar to close below the 10 week MA. This is setting the dollar up for an extremely left translated weekly cycle formation, which is what we would expect during the 3 year cycle decline.
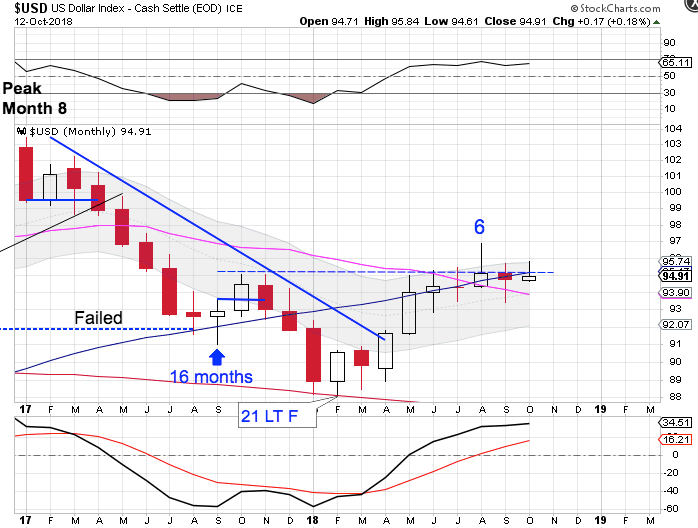
August remains as the yearly cycle high. The new high on month 6 begins to shift the odds towards a right translated yearly cycle formation. A right translated yearly cycle formation would align with February hosting an early 3 year cycle low.
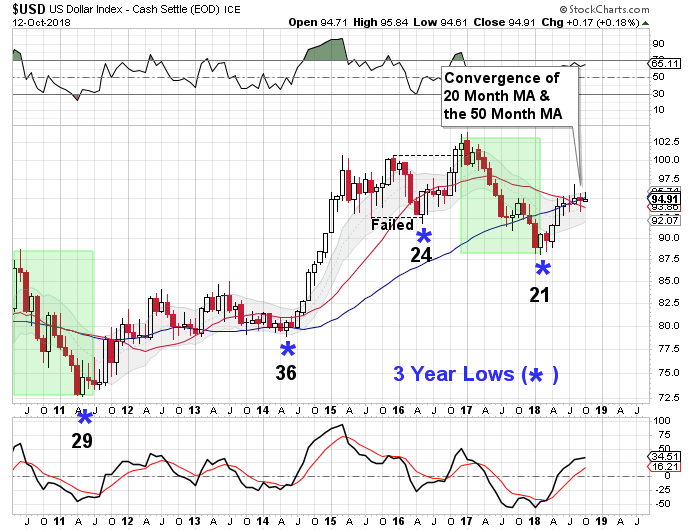
The decline into the 2014 and the 2016 three year cycle lows were somewhat mild. I highlighted the decline into the 2011 three year cycle low and the decline into the February low. The decline into the February low does have the look of a three year cycle decline. I think that we need to proceed with February being labeled as an early 3 year cycle low.
The dollar did break above convergence of the declining 20 month MA and the 50 month MA to confirm that February hosted a yearly cycle low. But a bearish monthly reversal formed in August. A close back below the 20 month MA will signal that the new 3 year cycle has topped and that the dollar is continuing its decline into its 15 year super cycle low.
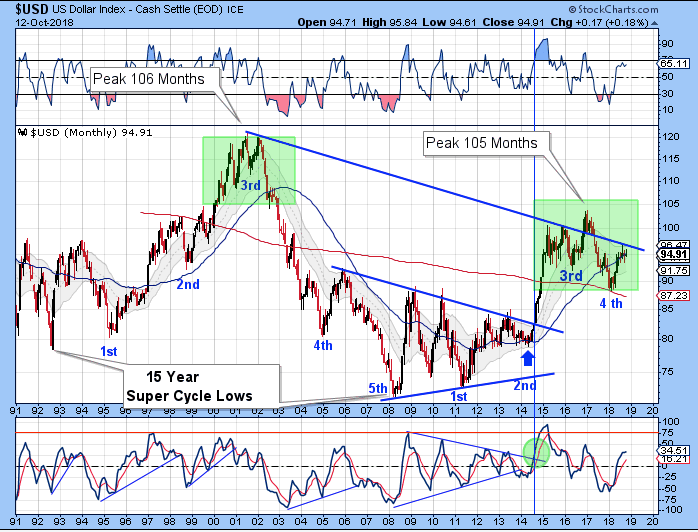
The dollar cycles through a 15 year super cycle. Each 15 year super cycle is embedded with five 3 year cycles. The dollar’s last 15 year super cycle peaked in 2001 on month 106, then declined into its third 3 year cycle low. The topping pattern in 2001 is similar to the current set up. The confirmation of a failed 3 year cycle back in August, 2017 confirms that the dollar has begun its 15 year super cycle decline (bear market). Therefore we are looking for the dollar to be rejected by the declining multi year trend line to continue its decline into the 15 year super cycle low.
Stocks
Stocks printed their lowest point on Thursday, day 40. That places stocks in their timing band for a DCL.
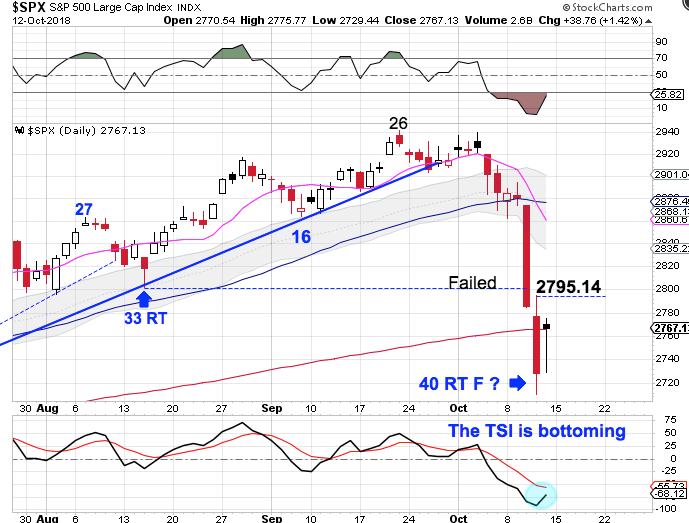
Stocks printed an inside day on Friday, closing above the 200 day MA. Stocks will need to break above 2795.14 in order to form a swing low to signal a new daily cycle. However, the 764 million Selling on Strength that printed on Friday suggests that the bottom is not yet in. If Thursday was the DCL then stocks should not be printing large SOS days ...
Stocks have begun to close below the lower daily cycle band which ends the daily uptrend and begins a daily downtrend.
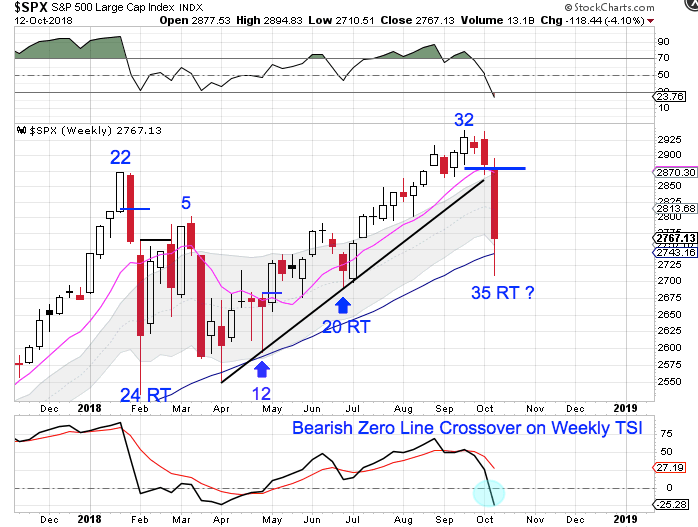
The crash that occurred on Wed tends to happen in extremely right translated weekly cycle formations. I still believe that the Fed prevented stocks from dropping into an ICL back on week 20. Which makes this an extremely stretched weekly cycle at week 35. Therefore once the daily cycle low forms, that will also signal a new intermediate cycle .
Despite dropping 4.10% this week stocks still managed to close above the lower weekly cycle band. Therefore they remain in their weekly uptrend. As long as a weekly swing low forms above the lower weekly cycle band then they will remain in their weekly uptrend. Ideally, I would like to see a narrow range lower low form next week in order to ease the parameters for forming a weekly swing low. That would set stocks up for an ICL heading into the most bullish time of the year.
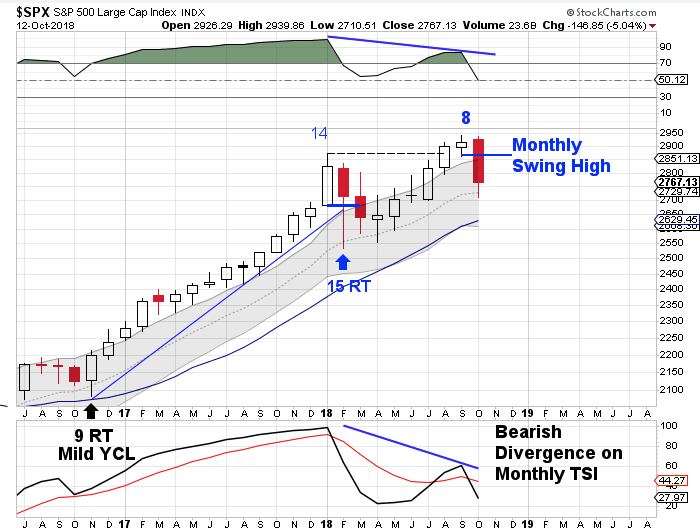
October is month 8 for the yearly equity cycle. The new high on month 7 shifts the odds towards a right translated yearly cycle formation. Stocks are firmly in a yearly uptrend. However, bearish divergences are beginning to develop on the monthly oscillators. If stocks form a monthly swing high and close back below the upper monthly cycle band that would be our signal that stocks are declining into their yearly cycle low.
Author

LikesMoney
Independent Analyst
Assets (such as stocks, gold, and the dollar) have identifiable cycles.


