Cycle Trading: The Weekend Report
The Dollar
In real time day 36 did look like the DCL. Then the dollar printed the huge bullish engulfing candle on Thursday. That extended the daily cycle decline to make Thursday day 41 of an extended daily cycle.
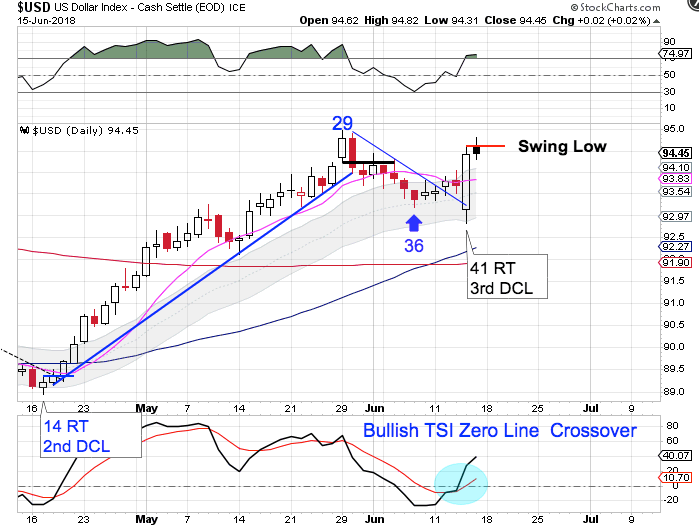
The dollar formed a swing low on Friday confirming that day 41 was the DCL. The dollar has now begun its fourth daily cycle which will take the weekly cycle into its timing band for an intermediate cycle decline. The dollar is in a daily uptrend. It will remain in its uptrend unless it closes below the lower daily cycle band.
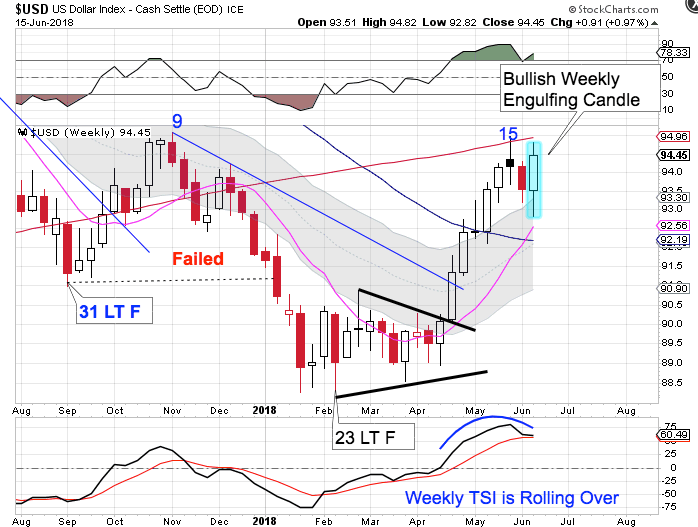
The dollar printed is highest point on week 15 then formed a weekly swing high. But this past week the dollar formed a weekly bullish engulfing candle. This was week 17 for the intermediate dollar cycle. Allowing 6 to 8 weeks for the new daily cycle would take the dollar into its timing band for is intermediate cycle low. Therefore we are expecting that the new daily cycle form as a left translated cycle.
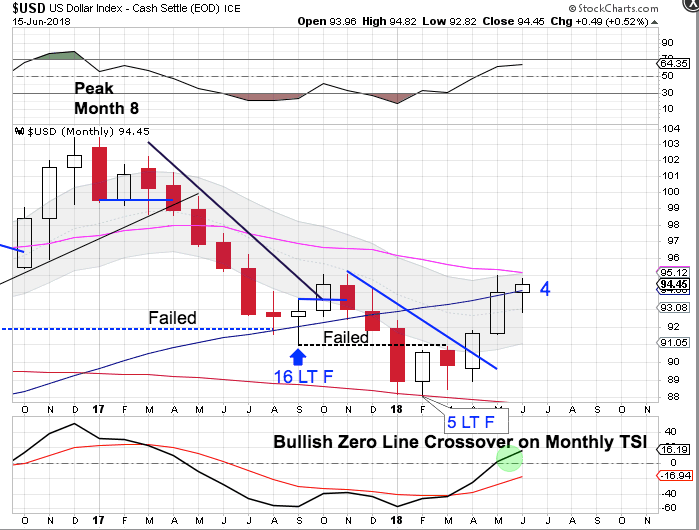
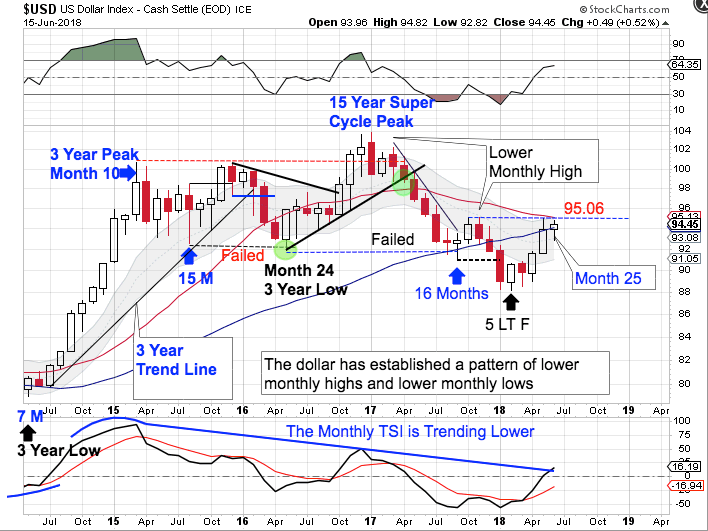
The dollar broke above the declining monthly trend line in April and delivered bullish follow through in May to signal that February hosted an yearly cycle low.
The bigger picture is that the dollar is declining into its 3 year cycle low. We should see left translated yearly cycle formations until the dollar prints its 3 year cycle low. So an early YCL sets up for the this yearly cycle to be stretched. The dollar is in a monthly downtrend. The dollar will remain in its monthly downtrend until it can close back above the upper monthly cycle band.
I would like to review a basic premise of cycle studies.
Once a cycle fails it cannot print a new cycle high.
Therefore if a cycle fails then goes on to print a new high, that confirms a new cycle has begun.
In May of 2016 the dollar broke below the previous yearly cycle low to form a failed yearly cycle. The failed yearly cycle confirms that the 3 year cycle was in decline. When the dollar broke out to a new yearly high the following November, that confirmed that May 2016 was the 3 year cycle low.
After peaking in January, 2017 the dollar began its 3 year cycle decline.
The dollar went on to close below the previous yearly cycle low (May 2016) to form a failed yearly cycle and confirming that the 3 year cycle is in decline.
The dollar broke below the September 2017 low in January, 2018 to form another failed yearly cycle low, confirming the pattern of lower yearly highs and lower yearly lows.
The dollar then printed a shortened YCL in February. If the dollar breaks above the previous yearly high of 95.06 that would end the pattern of lower monthly highs to indicate that February hosted a shortened 3 year low.
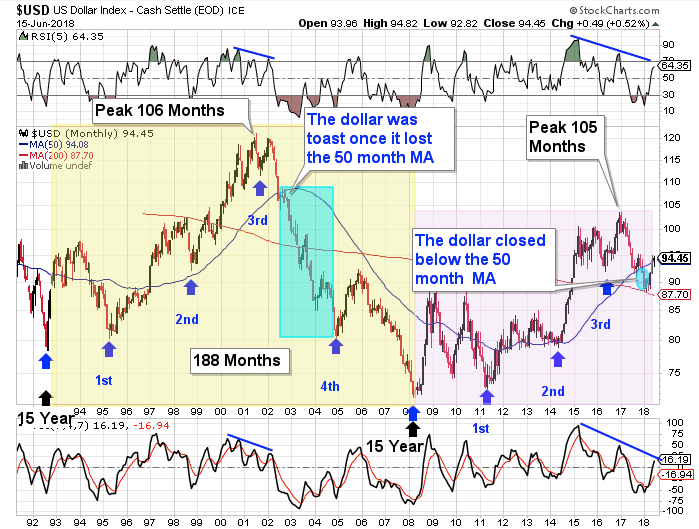
The dollar cycles through a 15 year super cycle. Each 15 year super cycle is embedded with five 3 year cycles. The dollar’s last 15 year super cycle peaked in 2001 on month 106, then declined into its third 3 year cycle low. The topping pattern in 2001 is very similar to the current set up. The confirmation of a failed 3 year cycle back in September, 2017 confirms that the dollar has begun its 15 year super cycle decline (bear market).
Stocks
The daily equity cycle peaked on day 28 and formed a daily swing high on Friday. With stocks in their timing band for a daily cycle decline the swing high signals that the daily cycle decline is beginning.
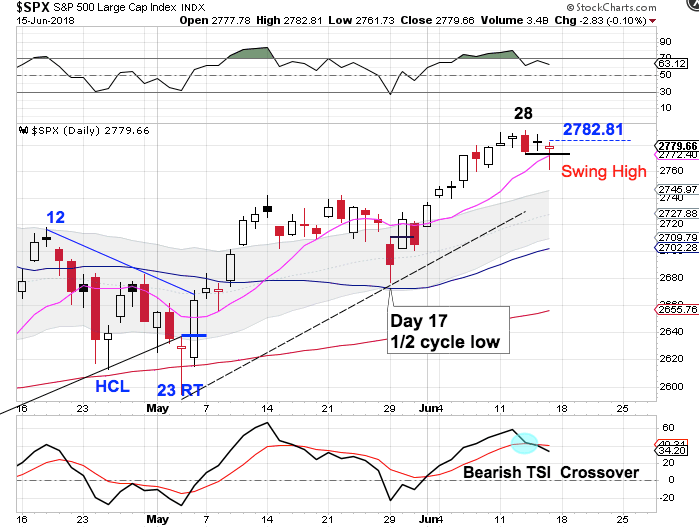
While stocks broke below the 10 day MA on Friday they ended up closing above it to form a bullish reversal. This is setting up a possible cycle band buy signal. A break above 2782.81 will form a swing low above the upper daily cycle band confirming a cycle band buy signal.
While our cyclical expectation is for stocks to decline into a daily cycle low, the Advance/Decline line is delivering a bullish expectation.
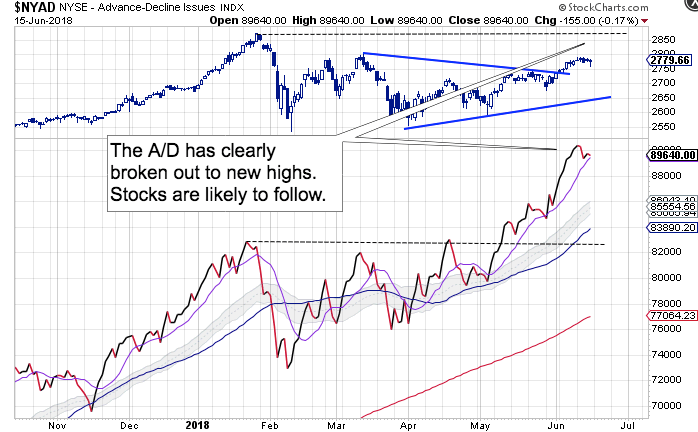
The Advanced/Decline line has clearly broken out to new highs and stocks are likely to follow. So while stocks are in their timing band to seek out a DCL and formed a swing high, if a swing low forms here stocks could be setting up for a trending move.
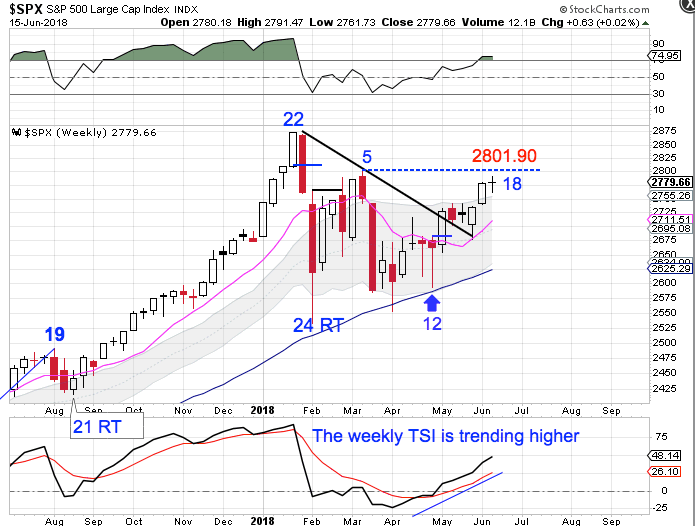
A break above 2801.90 will shift the odds towards a right translated weekly cycle formation. This was week 18 for the intermediate cycle, placing stocks in their timing band for an intermediate cycle decline. A weekly swing high is required to begin the intermediate cycle decline. The earliest a weekly swing high can form will be next week. Stocks are in a weekly uptrend. They will remain in their weekly uptrend unless they close below the lower weekly cycle band.
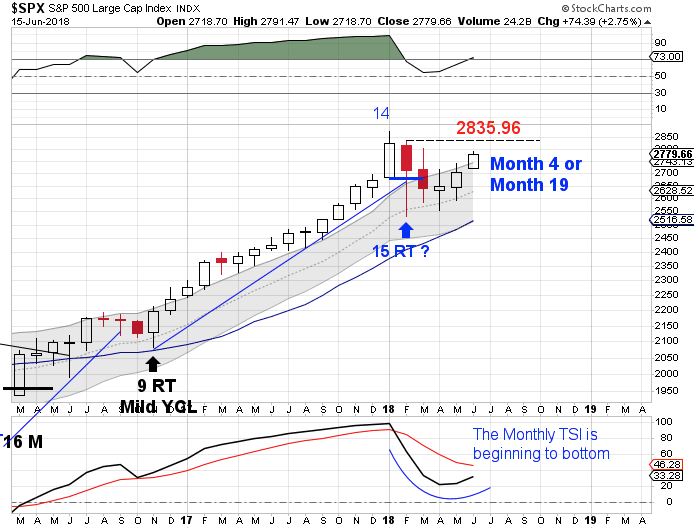
The yearly equity cycle peaked in January. Stocks have formed a clear and convincing monthly swing high and delivered a break of the monthly trend line to signal the yearly cycle decline. Stocks then went on to print their lowest point in February. That was month 15, placing stocks late in their timing band for a yearly cycle low. A monthly swing low is required in order to confirm a new yearly cycle. Barring a break lower, stocks would need to break above the February high of 2835.96 in order to form a monthly swing low.
Author

LikesMoney
Independent Analyst
Assets (such as stocks, gold, and the dollar) have identifiable cycles.


