EUR/USD Current price: 1.1355
View Live Chart for the EUR/USD
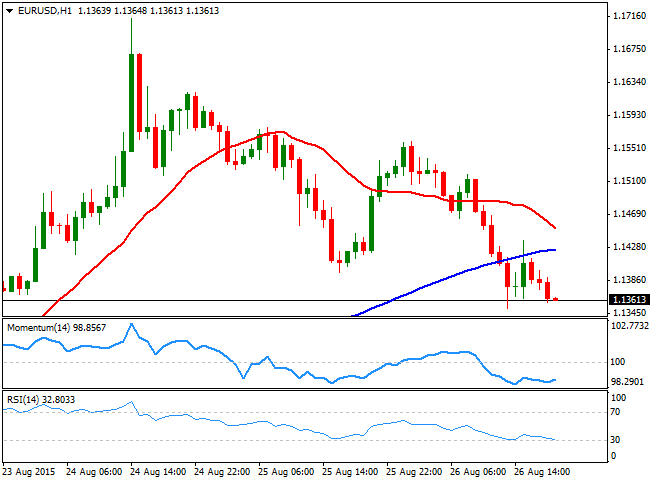
The American dollar wiped out all of its weekly losses against most of its rivals, exception made by the Japanese Yen that maintains most of its latest gains. Dollar's comeback however, was limited by William Dudley, President of the Reserve Bank of New York, who said that a September rate hike seems less compelling now than a few weeks ago. Indeed, the ongoing worldwide markets' turmoil is not the best scenario for a lift off, and investors know it, having already priced in the minimum chances of a FED rate hike for September.
The main event of the day was US Durable Goods Orders for July, climbing in July 2.0% against expectations of a 0.4% decline. The release gave an already on-demand greenback an additional boost, with the EUR/USD pair reaching a fresh weekly low of 1.1351. The pair corrected intraday up to 1.1437 on Dudley's dovish comments, but the general optimism that took over markets in the second half of the day prevailed, and the EUR/USD remains near its daily lows, with the hourly chart showing that during its latest advance, sellers surged around the 100 SMA. In the same chart, the technical indicators are losing their bearish potential near oversold levels, but are far from suggesting the pair may change course. In the 4 hours chart, however, the bearish momentum remains strong, with the technical indicators heading sharply lower into the red and the price well below a now flat 20 SMA.
Support levels: 1.1345 1.1300 1.1260
Resistance levels: 1.1420 1.1455 1.1500
EUR/JPY Current Price: 136.80
View Live Chart for the EUR/JPY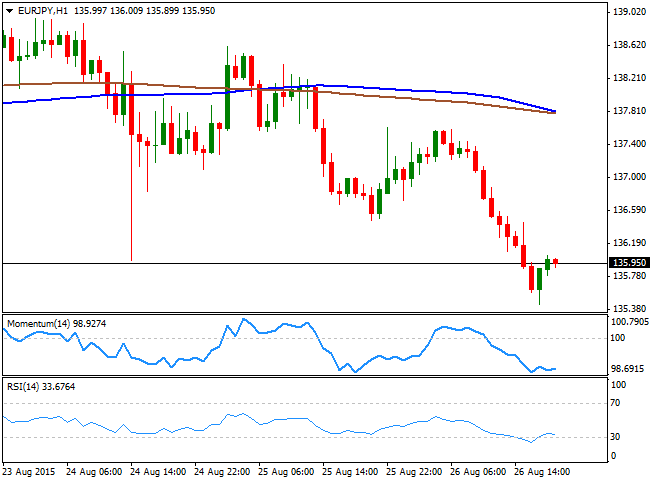
Euro negative tone helped the EUR/JPY pair to reach a fresh 3-week low of 135.43, from where it managed to bounce some amid rising Wall Street pressuring the Japanese Yen. The pair however, seems unable to retake the 136.00 level, and the 1 hour chart shows that the price remains well below its 100 and 200 SMAs, both around 137.80/90 and slowly catching up with the latest sharp decline. In the same chart, the technical indicators remain in extreme oversold levels, with the RSI indicator turning south around 33 and reflecting the lack of buying interest. In the 4 hours chart, the price is well below their moving averages, while the Momentum indicator is bouncing well into negative territory and the RSI hovers around 33, in line with the shorter term view. At this point the price needs to extend beyond 136.65 to be able to reverse its current bearish bias, albeit additional declines below the mentioned daily low, exposes the pair to a steady decline towards the 134.40 price zone.
Support levels: 135.45 134.90 134.40
Resistance levels: 136.20 136.65 137.10
GBP/USD Current price: 1.5470
View Live Chart for the GPB/USD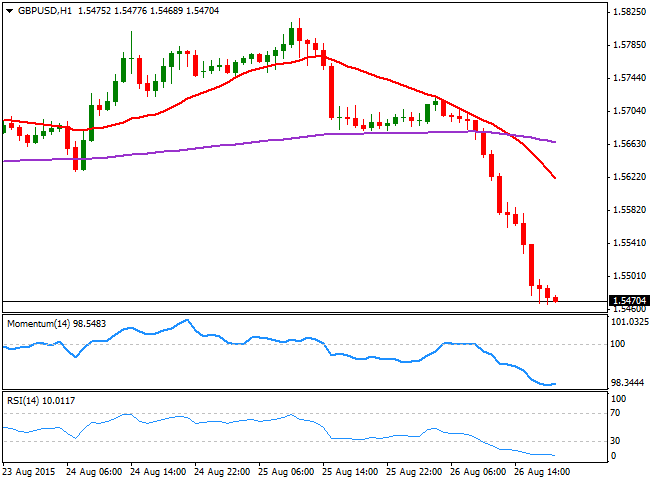
The British Pound plummeted to a fresh 2-week low against the greenback, as fears of a delay in a possible rate hike extended to the UK. The GBP/USD lost over 200 pips daily basis, having been under pressure ever since the European opening, and with no clear catalyst behind the early decline, later supported by dollar's demand. The pair trades back around the base of these last 2-month range, which increases the potential of a mid-bearish continuation after the failed upward breakout, earlier this week. Short term, the 1 hour chart shows that the technical indicators are starting to look exhausted towards the downside in extreme oversold levels, but remain far from suggesting an upward correction ahead, whilst the 20 SMA heads sharply lower well above the current price. In the 4 hours chart, the Momentum indicator heads sharply lower , despite being in oversold territory, whilst the RSI indicator heads lower around 27. Due to the sharp decline and the fact that the price is at a critical support level, the pair may see some consolidation, or even a shallow bounce, before setting another directional move, yet as long as the price remains below 1.5520, the risk remains towards the downside.
Support levels: 1.5455 1.5410 1.5370
Resistance levels: 1.5520 1.5560 1.5610
USD/JPY Current price: 119.54
View Live Chart for the USD/JPY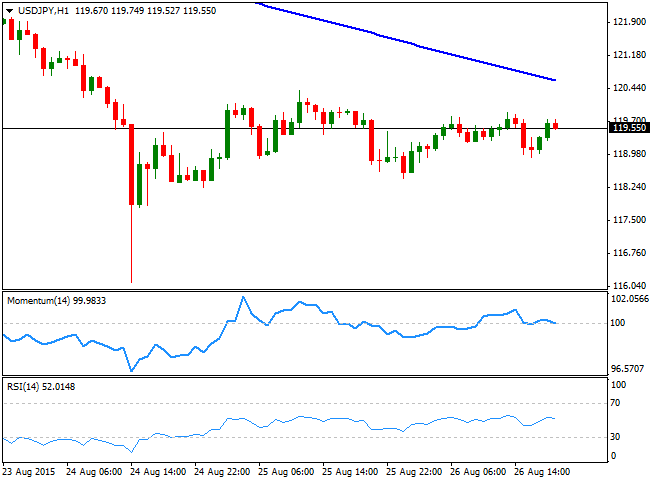
The USD/JPY pair spend most of the day consolidating around the 119.50 level, having advanced some during the Asian session, helped by the Nikkei 225 strong recovery. The pair reached a daily high of 119.91 after the release of US positive data, but retreated after being unable to retake the 120.00 critical level. Technically, the 1 hour chart shows that the 100 SMA maintains a strong bearish slope around the 120.60 level, providing a strong dynamic resistance in the case of further advances. In the same chart, however, the technical indicators present a neutral stance, turning slightly lower around their mid-lines, lacking clear directional strength. In the 4 hours chart, the Momentum indicator extended its advance and maintains its upward strength, but remains below the 100 level, whilst the RSI indicator heads slightly higher around 40, all of which confirms the need of some additional gains before the upward continuation becomes clearer.
Support levels: 119.60 119.20 118.80
Resistance levels: 120.10 120.60 121.05
AUD/USD Current price: 0.7102
View Live Chart for the AUD/USD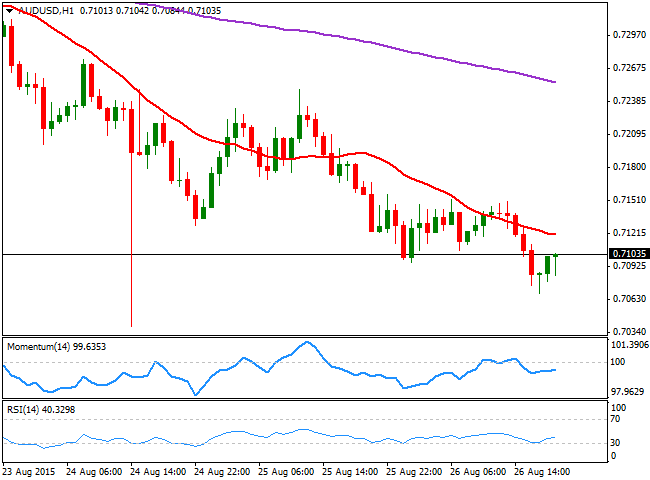
The AUD/USD pair edged lower for a third day in-a-row, falling down to 0.7069 in the American afternoon before bouncing back towards the 0.7100 price zone. The Australian currency has been largely affected by Chinese woes this week, as an economic slowdown in the world's second largest economy that already implies a slump in commodities, will weigh on the country's terms of trade. The technical picture continues to favor the downside, as the 1 hour chart shows that the price is now below a bearish 20 SMA, whilst the technical indicators hold below their mid-lines, although lacking directional strength. In the 4 hours chart the 20 SMA maintains its strong bearish slope well above the current level, whilst the RSI indicator heads lower around 33, all of which confirms additional declines. Below the mentioned daily low, the decline should extend down to 0.7031, Monday's low, whilst below this last, a steady decline towards 0.6990 is likely for the upcoming sessions.
Support levels: 0.7070 0.7030 0.6990
Resistance levels: 0.7145 0.7190 0.7240
Recommended Content
Editors’ Picks
EUR/USD edges lower toward 1.0700 post-US PCE

EUR/USD stays under modest bearish pressure but manages to hold above 1.0700 in the American session on Friday. The US Dollar (USD) gathers strength against its rivals after the stronger-than-forecast PCE inflation data, not allowing the pair to gain traction.
GBP/USD retreats to 1.2500 on renewed USD strength

GBP/USD lost its traction and turned negative on the day near 1.2500. Following the stronger-than-expected PCE inflation readings from the US, the USD stays resilient and makes it difficult for the pair to gather recovery momentum.
Gold struggles to hold above $2,350 following US inflation

Gold turned south and declined toward $2,340, erasing a large portion of its daily gains, as the USD benefited from PCE inflation data. The benchmark 10-year US yield, however, stays in negative territory and helps XAU/USD limit its losses.
Bitcoin Weekly Forecast: BTC’s next breakout could propel it to $80,000 Premium

Bitcoin’s recent price consolidation could be nearing its end as technical indicators and on-chain metrics suggest a potential upward breakout. However, this move would not be straightforward and could punish impatient investors.
Week ahead – Hawkish risk as Fed and NFP on tap, Eurozone data eyed too

Fed meets on Wednesday as US inflation stays elevated. Will Friday’s jobs report bring relief or more angst for the markets? Eurozone flash GDP and CPI numbers in focus for the Euro.