EUR/USD Current price: 1.1362
View Live Chart for the EUR/USD

Chinese rate cut failed to fully restore the local market's confidence, as the Shanghai Composite closed again in the rate, although with moderated losses. The index fell 1.23%, whilst European equities traded in the red ever since the day started. The EUR/USD pair reached a daily high of 1.1560 at the beginning of the Asian session, with the dollar taking a hit from the sudden last-minute reversal of Wall Street. Ahead of the opening however, US stocks are firming up.
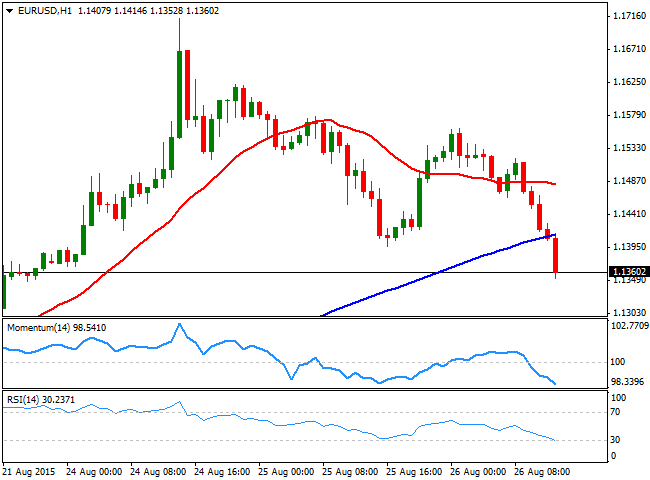
The greenback grinded higher all through the European morning, helped by ECB's Praet, who warned about the downward risk of inflation due to falling commodity prices, nothing really new. The EUR/USD pair extended its decline below the 1.14000 level, breaking through Tuesday's low, and practically erasing all of Monday's panic-related gains. In the US, early data showed that the mortgage applications rose just by 0.2% compared to previous 3.6%. But the star of the day was US Durable Goods Orders, expected to decrease by 0.4% in July, resulting finally at 2.0% boosting dollar's advance. The EUR/USD accelerated its decline and the 1 hour chart shows that the pair is now below its 100 SMA, whilst the technical indicators maintain strong bearish slopes below their mid-lines, supporting further slides. In the 4 hours chart, the technical indicators also present a strong downward momentum, supporting a retest of the 1.1300 level should local share markets maintain their positive tone.
Support levels: 1.1345 1.1300 1.1260
Resistance levels: 1.1420 1.1455 1.1500
GBP/USD Current price: 1.5572
View Live Chart for the GPB/USD
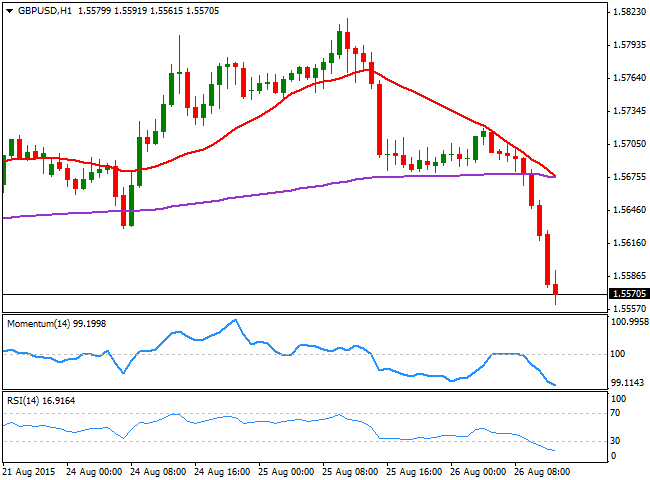
The British Pound was unable to hold ground, sliding against the greenback to fresh lows below the 1.5600 level ahead of the US data release. The up beating figures sent the pair down to 1.5561, and despite the almost 150 pips intraday slide, the short term picture continues to favor the downside, as in the 1 hour chart, the technical indicators head lower in oversold territory, whilst the 20 SMA maintains a sharp bearish slope well above the current level. In the 4 hours chart, the RSI indicator heads lower around 35, the Momentum indicator hovers below its 100 line, whilst the price has accelerated through its 200 EMA, currently at 1.5600 and the level to follow now, as if it holds, further declines could be expected towards the 1.5520 region.
Support levels: 1.5555 1.5520 1.5480
Resistance levels: 1.5600 1.5635 1.5680
USD/JPY Current price: 119.85
View Live Chart for the USD/JPY
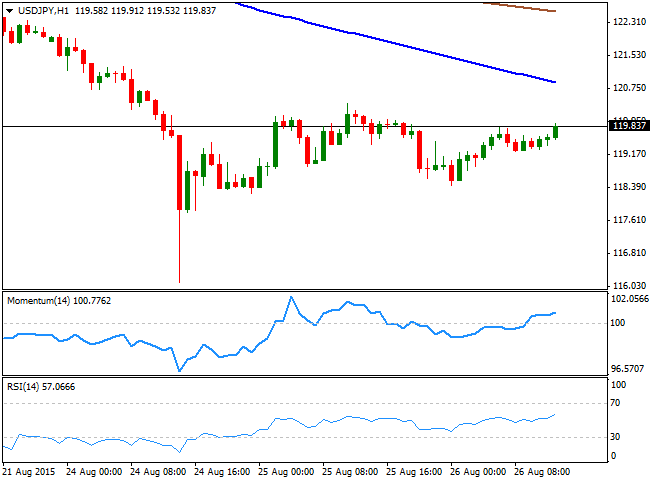
Further gains above 120.40. The USD/JPY pair advanced at the beginning of the day, having sunk below the 119.00 level on Wall Street's negative close last Tuesday. The pair however, traded in a tight range around 119.50 for most of the European session, accelerating higher before the release of the US Durable Goods Orders data for July. The figures surprised to the upside, favoring a spike in the pair that anyway stands below the 120.00 figure. Short term, the upside remains limited, given that in the 1 hour chart, the 100 SMA maintains a strong bearish slope well above the current price, and widening the distance with the 200 SMA around 122.60. In the same chart however, the technical indicators aim higher above their mid-lines, suggesting no selling interest around at the time being. In the 4 hours chart, the technical indicators remain below their mid-lines, lacking enough strength to confirm further gains. Tuesday high at 120.40 is the level to break to confirm a firmer upward tone, eyeing then a continuation towards the 121.00 figure.
Support levels: 119.60 119.20 118.80
Resistance levels: 120.00 120.40 120.90
AUD/USD Current price: 0.7136
View Live Chart for the AUD/USD
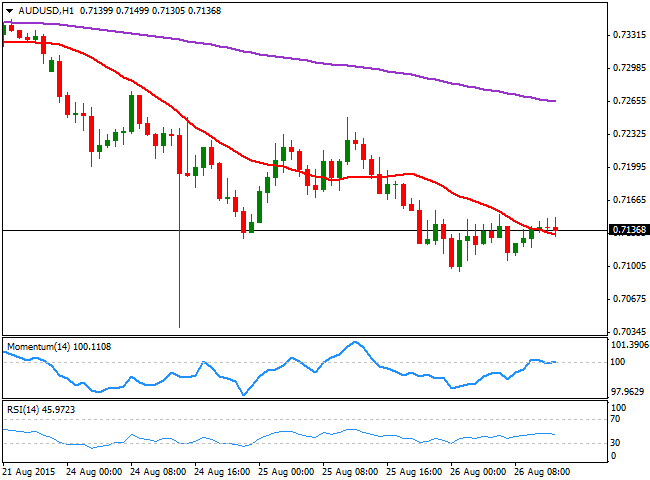
The AUD/USD fell down to 0.7096 earlier this Wednesday, before bouncing back up to 0.7149, from where the pair is barely retracing after the release of US data. The pair is short term neutral, with the price struggling around a bearish 20 SMA and the technical indicators lacking directional strength around their mid-lines. In the 4 hours chart, however, the bearish bias prevails, with the price well below a strongly bearish 20 SMA and the technical indicators turning back south after a limited upward correction in positive territory.
Support levels: 0.7095 0.7050 0.7010
Resistance levels: 0.7150 0.7200 0.7240
Recommended Content
Editors’ Picks
AUD/USD dips below 0.6600 following RBA’s decision

The Australian Dollar registered losses of around 0.42% against the US Dollar on Tuesday, following the RBA's monetary policy decision to keep rates unchanged. However, it was perceived as a dovish decision. As Wednesday's Asian session began, the AUD/USD trades near 0.6591.
EUR/USD lacks momentum, churns near 1.0750

EUR/USD cycled familiar levels again on Tuesday, testing the waters near 1.0750 as broader markets look for signals to push in either direction. Risk appetite was crimped on Tuesday after Fedspeak from key US Federal Reserve officials threw caution on hopes for approaching rate cuts from the Fed.
Gold wanes as US Dollar soars, unfazed by lower US yields

Gold price slipped during the North American session, dropping around 0.4% amid a strong US Dollar and falling US Treasury bond yields. A scarce economic docket in the United States would keep investors focused on Federal Reserve officials during the week after last Friday’s US employment report.
Solana FireDancer validator launches documentation website, SOL price holds 23% weekly gains

Solana network has been sensational since the fourth quarter (Q4) of 2023, making headlines with a series of successful meme coin launches that outperformed their peers.
Living vicariously through rate cut expectations

U.S. stock indexes made gains on Tuesday as concerns about an overheating U.S. economy ease, particularly with incoming economic reports showing data surprises at their most negative levels since February of last year.