EUR/USD Current price: 1.0705
View Live Chart for the EUR/USD

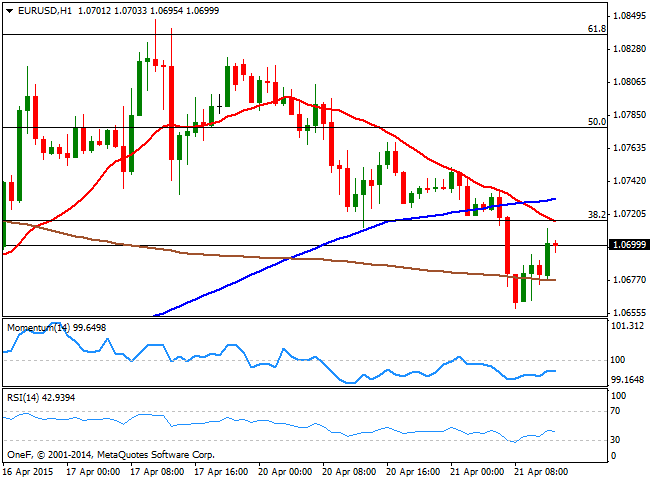
The EUR/USD pair recovered from a daily low set at 1.0659 in the European morning, following market comments about the ECB studying a way to limit financial aid to Greece. In Germany, the ZEW survey for April showed that the local Economic Sentiment fell for the first time since October 2014, down to 53.3 from previous 54.8. In the EZ however, Economic Sentiment improved above expected in the same month. There are no relevant fundamental readings scheduled for the US, with the market then probably continue trading on sentiment. Short term, the 1 hour chart shows that the price stands below the 38.2% retracement of its latest bearish run at 1.0715, the immediate resistance, whilst the 20 SMA heads lower around it. In the same chart, the technical indicators are bouncing from their oversold levels but remain below their mid-lines, which suggest some follow through above the mentioned level is required to confirm additional advances. In the 4 hours chart the Momentum indicator heads lower below 100 whilst RSI indicator stands flat around 48.
Support levels: 1.0680 1.0640 1.0590
Resistance levels: 1.0715 1.0745 1.0775
GBP/USD Current price: 1.4900
View Live Chart for the GBP/USD
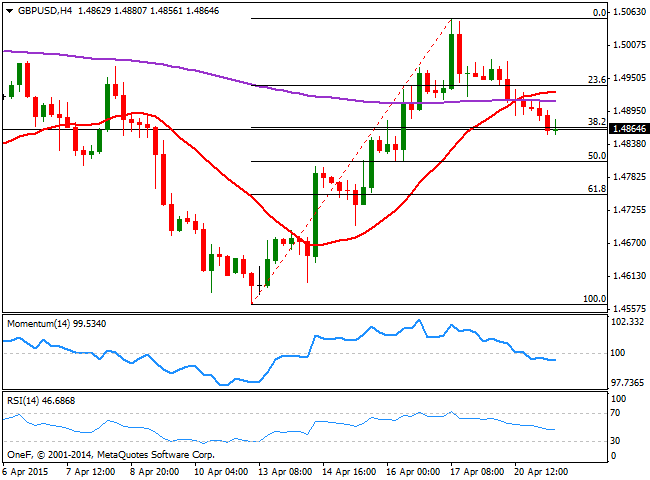
The GBP/USD pair aims to recover the 1.4900 figure, with the 1 hour chart showing the price extending above a flat 20 SMA, whilst the technical indicators aim higher above their mid-lines, anticipating additional advances towards the 1.4940 area, the immediate Fibonacci resistance. In the 4 hours chart however, the Momentum indicator heads lower below the 100 level, whilst the 20 SMA stands flat around the mentioned 1.4940 level, reinforcing the resistance level. In this last chart, the RSI advances above 50, all of which supports limited intraday advances.
Support levels: 1.4870 1.4830 1.4790
Resistance levels: 1.4940 1.4985 1.5040
USD/JPY Current price: 119.35
View Live Chart for the USD/JPY
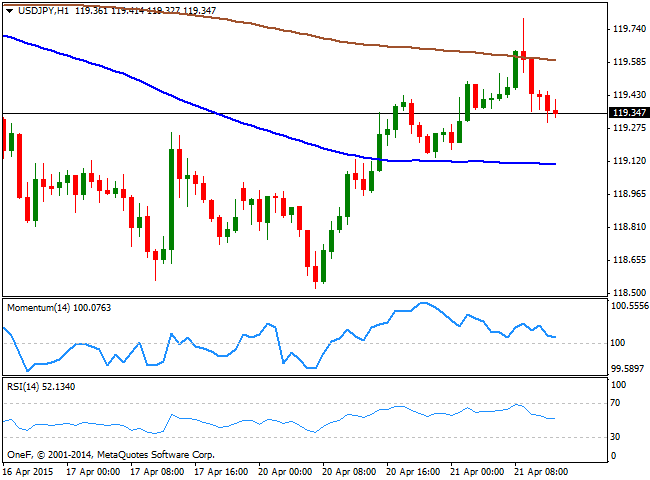
The USD/JPY advanced up to 119.79 earlier this Tuesday on broad dollar strength, albeit the pair eases ahead of the US opening. The 1 hour chart shows that the price failed to sustain gains beyond its 200 SMA, and now trades below it, but above the 100 SMA around the 119.00, providing an immediate short term support. In the same chart, the technical indicators are turning flat above their mid-lines after correcting overbought readings. In the 4 hours chart the price faltered around its 100 SMA, albeit the technical indicators remain above their mid-lines, with the Momentum indicator heading higher and the RSI lower around 52.
Support levels: 118.90 118.50 118.15
Resistance levels: 119.40 119.80 120.10
AUD/USD Current price: 0.7745
View Live Chart for the AUD/USD
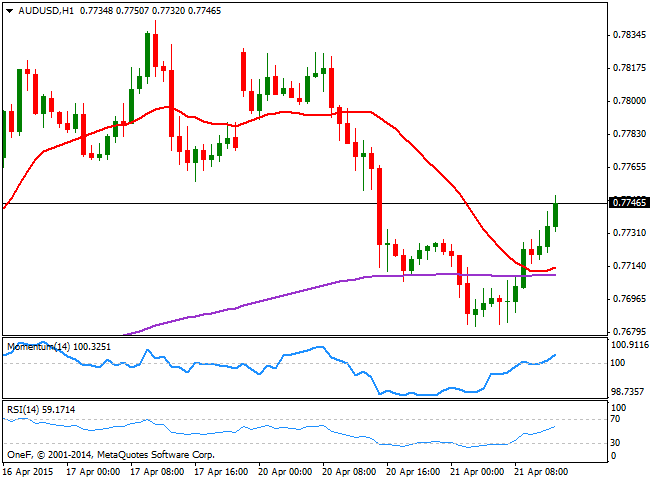
The Australian dollar is recovering from a daily low set at 0.7682 against the greenback, and presents a mild bullish tone in the short term, as the 1 hour chart shows that the price extends above its 20 SMA, whilst the technical indicators aim higher above their mid-lines. In the 4 hours chart however, the 20 SMA presents a bearish slope in the 0.7775 region, whilst the technical indicators remain below their mid-lines, suggesting advances may be temporal and that selling interest can reappear at higher levels.
Support levels: 0.7720 0.7685 0.7640
Resistance levels: 0.7775 0.7810 0.7845
Recommended Content
Editors’ Picks
EUR/USD edges lower toward 1.0700 post-US PCE

EUR/USD stays under modest bearish pressure but manages to hold above 1.0700 in the American session on Friday. The US Dollar (USD) gathers strength against its rivals after the stronger-than-forecast PCE inflation data, not allowing the pair to gain traction.
GBP/USD retreats to 1.2500 on renewed USD strength

GBP/USD lost its traction and turned negative on the day near 1.2500. Following the stronger-than-expected PCE inflation readings from the US, the USD stays resilient and makes it difficult for the pair to gather recovery momentum.
Gold struggles to hold above $2,350 following US inflation

Gold turned south and declined toward $2,340, erasing a large portion of its daily gains, as the USD benefited from PCE inflation data. The benchmark 10-year US yield, however, stays in negative territory and helps XAU/USD limit its losses.
Bitcoin Weekly Forecast: BTC’s next breakout could propel it to $80,000 Premium

Bitcoin’s recent price consolidation could be nearing its end as technical indicators and on-chain metrics suggest a potential upward breakout. However, this move would not be straightforward and could punish impatient investors.
Week ahead – Hawkish risk as Fed and NFP on tap, Eurozone data eyed too

Fed meets on Wednesday as US inflation stays elevated. Will Friday’s jobs report bring relief or more angst for the markets? Eurozone flash GDP and CPI numbers in focus for the Euro.