EUR/USD Current price: 1.2767
View Live Chart for the EUR/USD
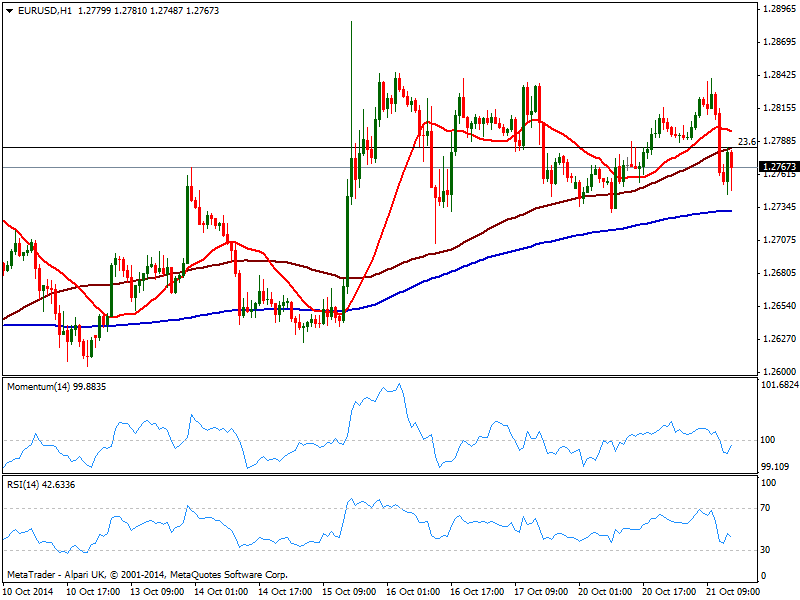
The EUR/USD was submitted to a short term selloff, following news the ECB will be buying corporate bonds for troubled economies such as Spain and Italy, down to 1.2745 on the day. But following the initial headline from a big news agency, another round of non supported news hit the wires stating the Central Bank has not yet put the issue of buying corporate bonds on the agenda for its December policy meeting. With the back and forth, the pair managed to recover some ground, yet stalled at 1.2780 price zone, limited by the critical Fibonacci level around which the pair has been hovering most of this week. Short term, the 1 hour chart shows now indicators below their midlines, and 20 SMA a few pips above mentioned Fibonacci level, while the 4 hours chart shows a mild negative tone, with price below a bearish 20 SMA and indicators turning south in neutral territory. Further declines below 1.2740 should lead to an extension towards 1.2700 while if below this last, the bearish movement will likely accelerate. Above 1.2790 however, chances turn back north, towards 1.2845 static resistance zone.
Support levels: 1.2740 1.2700 1.2660
Resistance levels: 1.2790 1.2845 1.2890
GBP/USD Current price: 1.6168
View Live Chart for the GBP/USD
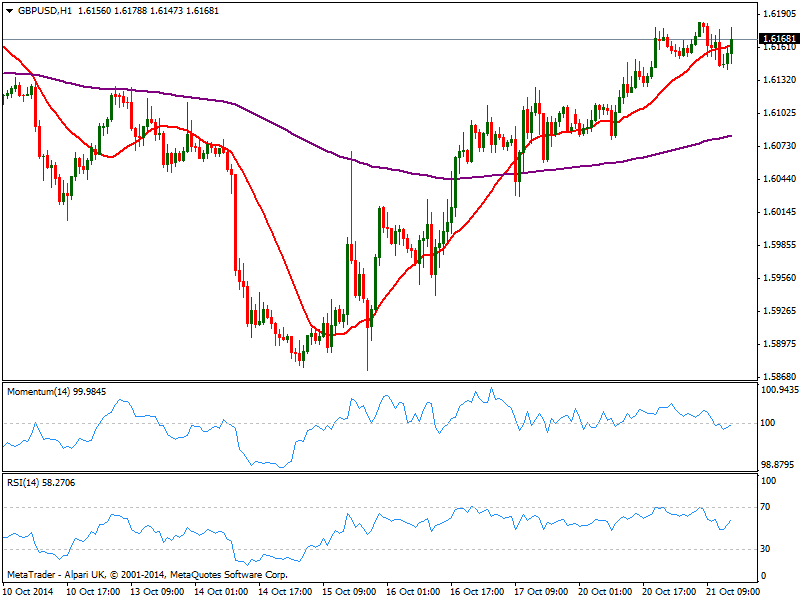
Pound maintains its strength against the greenback, having suffered a short term downward spike on EUR slide. The GBP/USD consolidates near its daily high of 1.6184, immediate resistance, with the 1 hour chart showing price trying to advance above its 20 SMA and indicators turning higher in neutral territory, showing no momentum at the time being. In the 4 hours chart price stands above its 20 SMA with momentum diverging lower yet still above its midline, this last limiting chances of a stronger slide. A break above the daily high may favor further gains towards 1.6220/30 price zone, whilst a break below 1.6125 will put the pair on the bearish path.
Support levels: 1.6125 1.6090 1.6060
Resistance levels: 1.6185 1.6220 1.6260
USD/JPY Current price: 106.69
View Live Chart for the USD/JPY
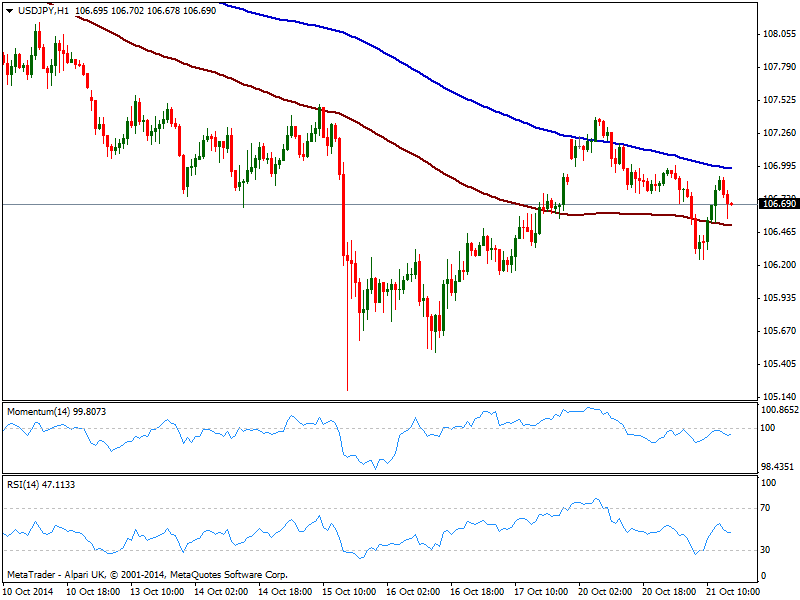
Slightly lower, the USD/JPY has shown little progress over the last couple sessions, albeit a lower low has been set at 106.24 pointing for some dominant bearish sentiment in the pair. The 1 hour chart shows price in between moving averages, with 100 one offering now support around 106.50; indicators in the same chart head lower below their midlines yet show no actual strength. In the 4 hours chart indicators turn lower around their midlines, also lacking directional strength at the time being.
Support levels: 106.60 106.30 106.05
Resistance levels: 107.05 107.35 107.60
AUD/USD Current price: 0.8821
View Live Chart of the AUD/USD
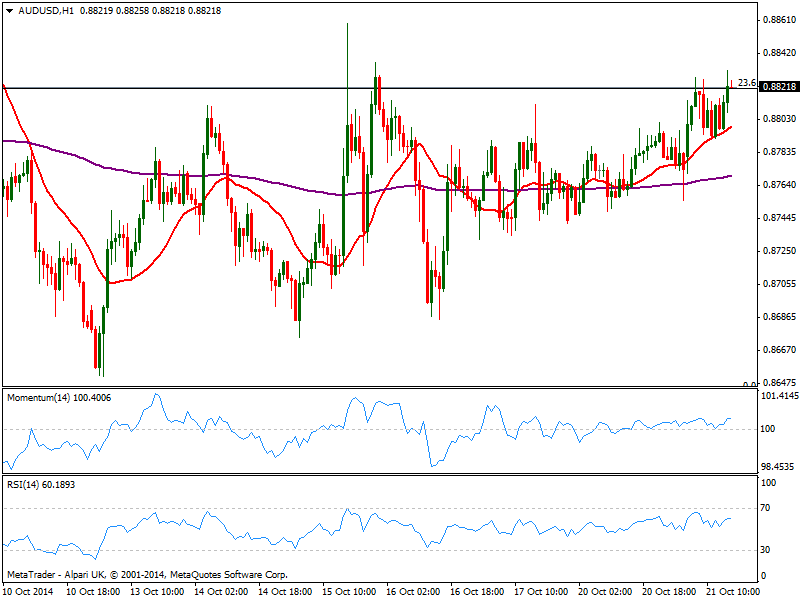
Aussie surged over Asian hours, helped by a better than expected Chinese GDP reading, and a not that dovish RBA Minutes. The AUD/USD however, stalled at the Fibonacci resistance of 0.8820, and despite pressuring the level the pair refuses to advance beyond it. The 1 hour chart shows 20 SMA offering short term intraday support now around 0.8890, while indicators lack strength yet stand above their midlines. In the 4 hours chart technical reading also present a mild positive tone, yet unless a clear acceleration above current levels, the upside remains limited.
Support levels: 0.8890 0.8770 0.8730
Resistance levels: 0.8820 0.8860 0.8900