EUR/USD Current price: 1.3193
View Live Chart for the EUR/USD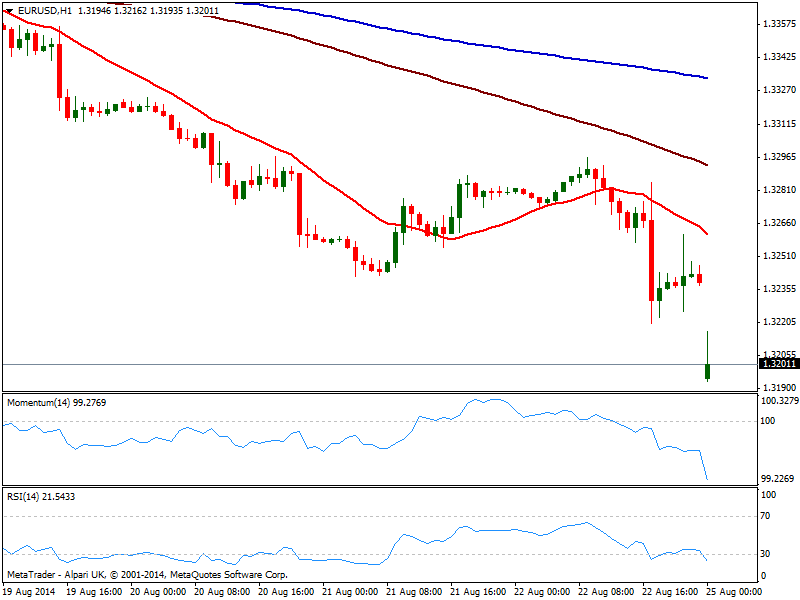
Draghi and Kuroda are to blame for the wild weekly openings in favor of the greenback, as both down talked their currencies over the weekend in Jackson Hole. On Friday’s speech, Mario Draghi came with the usual the ECB is ready to adjust its policy stance further, but as the weekend went by, he hit the wires again stating that if inflation drop continues, risks for price stability would increase and governing council would need to use all available tools in reaction. The EUR/USD flushed through 1.3200 early interbank trading, down to 1.3192 so far on the day.
Technically, the hourly chart presents a strong downward momentum coming from technical readings, mostly due to the 50 pips gap; in the 4 hours chart indicators entered oversold levels, with 20 SMA now offering intraday resistance at 1.3270 in case of a recovery.
Support levels: 1.3185 1.3150 1.3120
Resistance levels: 1.3210 1.3240 1.3270
EUR/JPY Current price: 137.59
View Live Chart for the EUR/JPY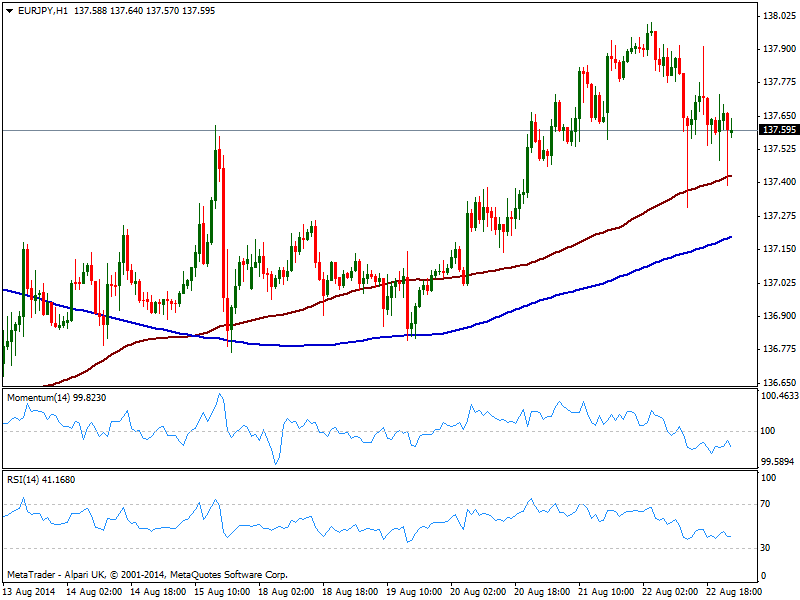
Japan BOJ´s Kuroda participated in a discussion panel on Saturday, making a point on QE being here to stay until inflation target is achieved, something that “may take some time”. Despite also weak across the board, yen holds steady against the euro, as both have been hit nastily by Central Bankers: the pair trades slightly lower at the opening, with the 1 hour chart showing 100 SMA offering immediate short term support at 137.40, and indicators turning south below their midlines, exposing the pair to a continued slide. In the 4 hours chart indicators retrace from overbought levels, but hold still above their midlines, limiting the downside at the time being.
Support levels: 137.40 136.90 136.40
Resistance levels: 138.00 138.40 138.90
GBP/USD Current price: 1.6537
View Live Chart for the GBP/USD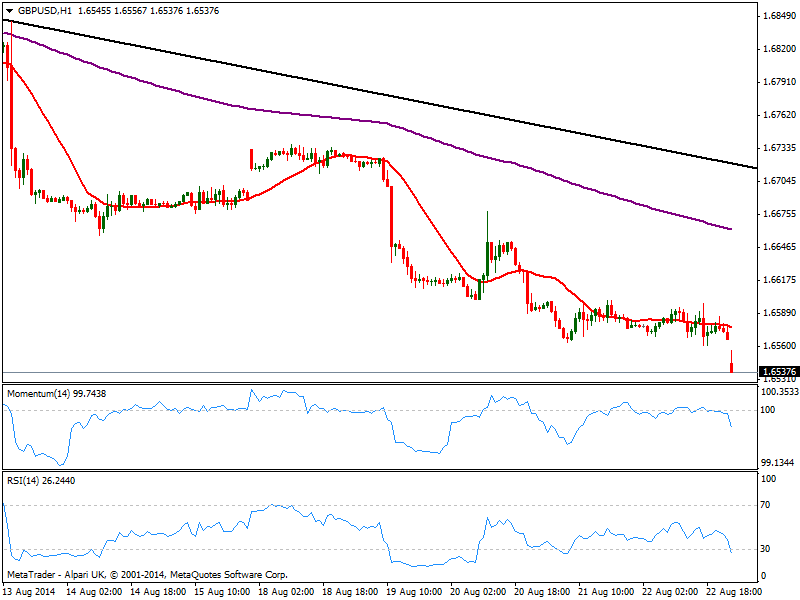
The GBP/USD also gapped lower weighted by dollar strength, with the pair breaking through critical support at 1.6545, past April monthly low. The hourly chart shows price almost filled the gap before resuming the downside, with 20 SMA capping the upside around 1.6580 and indicators maintaining a strong bearish slope. In the 4 hours chart technical readings present a strong bearish tone as seen on previous updates, favoring now a steady decline towards 1.6465, March this year monthly low.
Support levels: 1.6525 1.6490 1.6465
Resistance levels: 1.5480 1.6630 1.6680
USD/JPY Current price: 104.24
View Live Chart for the USD/JPY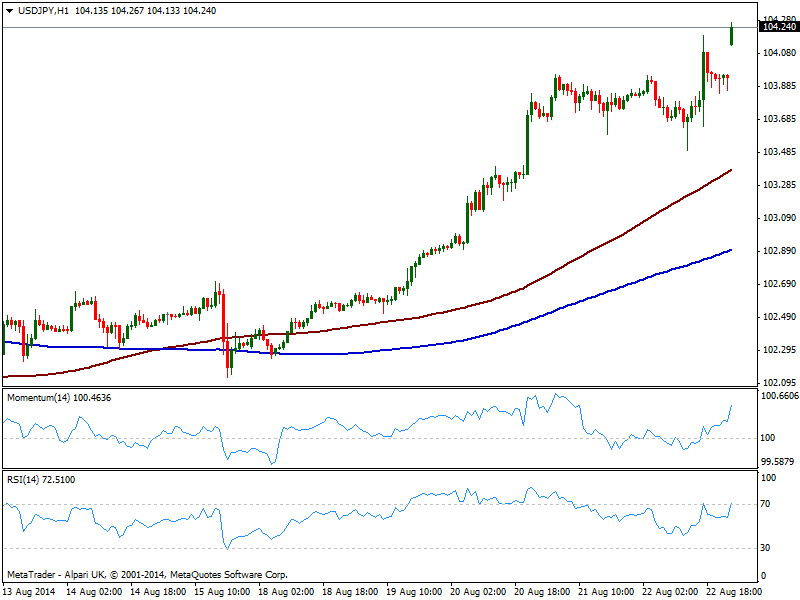
Trading at levels not seen since January this year, the USD/JPY advances steady above the 104.00 mark, with the hourly chart showing a strong upward momentum coming from technical readings, and 100 SMA at 103.45, widening the distance with 200 one at 102.90, usually a good sign of a trendy move. In the 4 hours chart the upside is also favored with the RSI bouncing higher from its 70 level, and momentum regaining the upside well into positive territory. There’s a long term descendant trend line coming from August 1998 monthly high of 147.68, at 105.25 for this August, and the level will likely act as a magnet before some profit taking triggers a downward correction.
Support levels: 104.05 103.90 103.40
Resistance levels: 104.45 104.80 105.25
AUD/USD Current price: 0.9293
View Live Chart for the AUD/USD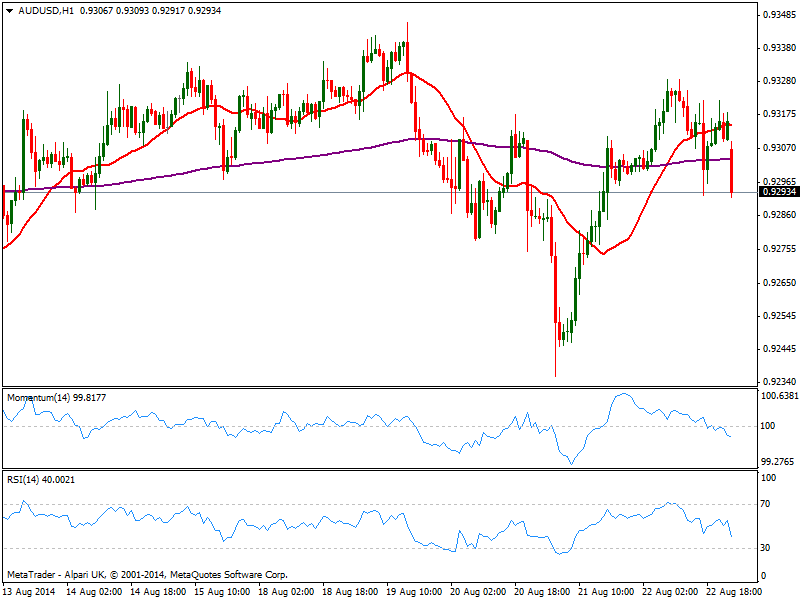
Aussie lost the 0.9300 mark against the greenback, with the pair trading now around Friday’s low and the hourly chart showing indicators accelerating south in bearish territory, and 20 SMA now offering dynamic resistance around 0.9315. In the 4 hours chart indicators turned south with price pressuring a mild bearish 20 SMA, not yet confirming further falls: key support stands at 0.9260 and a break below should lead to a continued slide towards the 0.9200/20 area, with 0.9330 probably attracting sellers in case of upward corrections.
Support levels: 0.9260 0.9220 0.9180
Resistance levels: 0.9330 0.9370 0.9410
Recommended Content
Editors’ Picks
EUR/USD edges lower toward 1.0700 post-US PCE

EUR/USD stays under modest bearish pressure but manages to hold above 1.0700 in the American session on Friday. The US Dollar (USD) gathers strength against its rivals after the stronger-than-forecast PCE inflation data, not allowing the pair to gain traction.
GBP/USD retreats to 1.2500 on renewed USD strength

GBP/USD lost its traction and turned negative on the day near 1.2500. Following the stronger-than-expected PCE inflation readings from the US, the USD stays resilient and makes it difficult for the pair to gather recovery momentum.
Gold struggles to hold above $2,350 following US inflation

Gold turned south and declined toward $2,340, erasing a large portion of its daily gains, as the USD benefited from PCE inflation data. The benchmark 10-year US yield, however, stays in negative territory and helps XAU/USD limit its losses.
Bitcoin Weekly Forecast: BTC’s next breakout could propel it to $80,000 Premium

Bitcoin’s recent price consolidation could be nearing its end as technical indicators and on-chain metrics suggest a potential upward breakout. However, this move would not be straightforward and could punish impatient investors.
Week ahead – Hawkish risk as Fed and NFP on tap, Eurozone data eyed too

Fed meets on Wednesday as US inflation stays elevated. Will Friday’s jobs report bring relief or more angst for the markets? Eurozone flash GDP and CPI numbers in focus for the Euro.