EUR/USD Current price: 1.3566
View Live Chart for the EUR/USD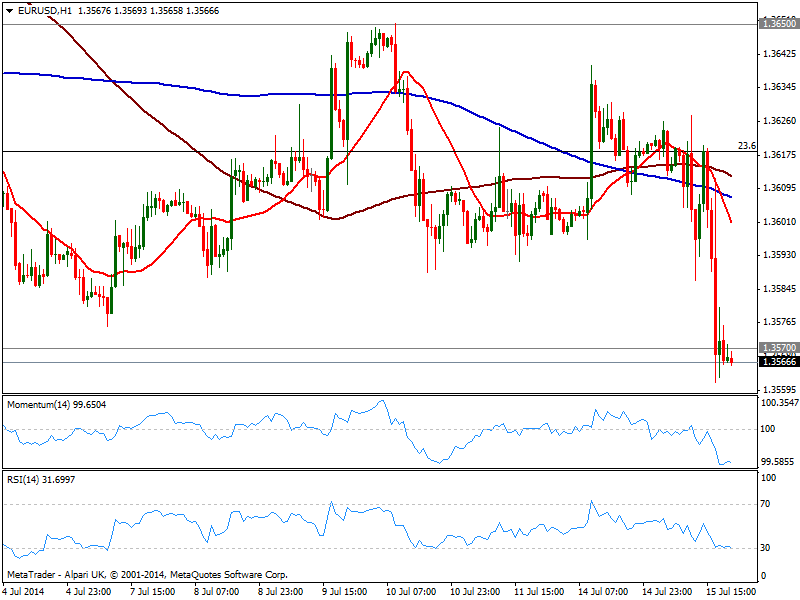
Dollar was buoyed since early Europe, but was ultra dove Yellen that gave the currency a final boost in her testimony before the Senate, saying that “increase in Federal Funds rates would likely occur sooner and be more rapid if labor market continues to improve”. Despite she reaffirmed mostly previous wording, anticipating a moderate growth, showing concerns on employment situation, and saying that bond buying will likely end after October meeting, investors choose to go for the greenback: the EUR/USD broke finally below 1.3570 and so far short term sellers had surged on approaches to the level.
Technically, the hourly chart shows price accelerated south below its moving averages, while indicators continue heading south near oversold levels, after a limited upward correction. In the 4 hours chart the pair presents a strong downward momentum which support some continued slide towards immediate short term support at 1.3535. If below, the key level to watch stands at 1.3476, this year low.
Support levels: 1.3535 1.3500 1.3476
Resistance levels: 1.3580 1.3620 1.3650
EUR/JPY Current price: 137.94
View Live Chart for the EUR/JPY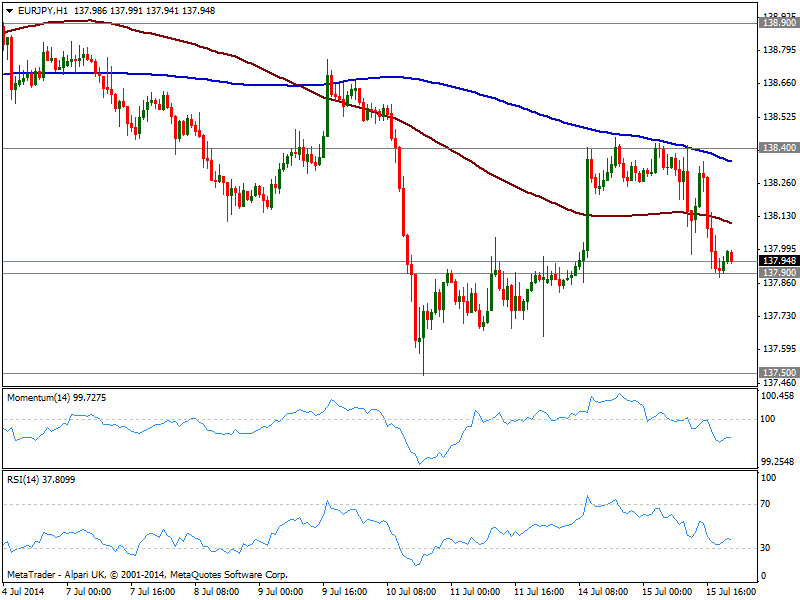
US stocks suffered early session, as the FED made an explicit warning on possible bubbles in social media and biotech stocks, pushing yen higher against most rivals. And while stocks return to breakeven levels by the close, the EUR/JPY trades near its daily low of 137.90. The hourly chart shows price developing back below its 100 and 200 SMAs, while indicators maintain a bearish bias. In the 4 hours chart indicators present a strong bearish slope, but stand right above their midlines, still not confirming further slides. Nevertheless, an acceleration below current levels, should lead to a quick test of the 137.50 level, ahead of 137.00 level for today. Recoveries should remain contained by 138.40 strong static resistance, where sellers are expected to surge.
Support levels: 137.90 137.50 137.00
Resistance levels: 138.40 138.90 139.35
GBP/USD Current price: 1.7146
View Live Chart for the GBP/USD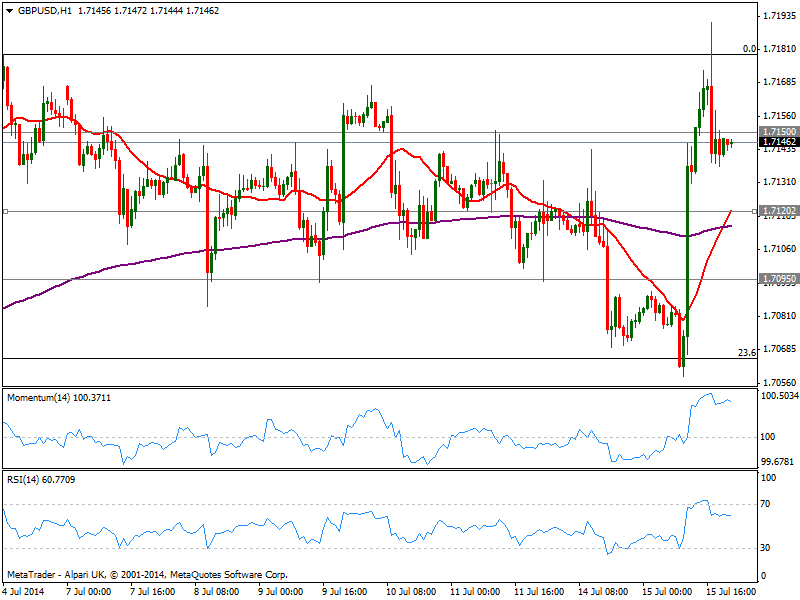
The GBP/USD soared to a fresh multiyear high of 1.7190, supported by a spike in inflation in the UK that surged to 1.9% yearly basis after the 4 year low known last month. Initial reaction against the greenback with Yellen statement did the rest, albeit general dollar demand finally weighted on the pair that anyway held pretty well into positive territory. The hourly chart shows indicators still near overbought levels and flat, showing little aims of a downward correction, while 20 SMA presents a strong bullish slope currently around 1.7120 acting as immediate short term support. In the 4 hours chart a mild positive tone prevails with indicators above their midlines, also showing no directional strength.
Support levels: 1.7120 1.7095 1.7060
Resistance levels: 1.7180 1.7220 1.7250
USD/JPY Current price: 101.68
View Live Chart for the USD/JPY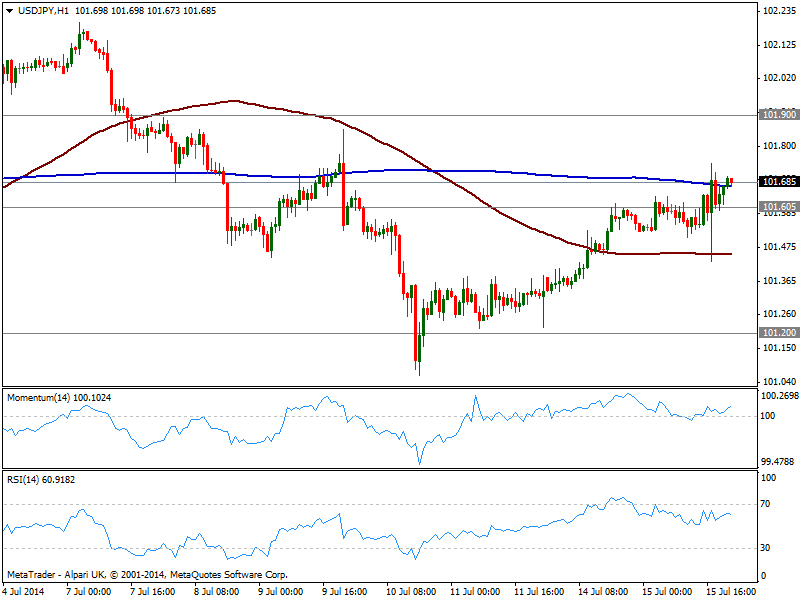
Between a rock and a hard place, USD/JPY edged slightly higher on the day, trapped between dollar demand and stocks weakness. The pair managed to advance some above the 101.60 level, and the hourly chart shows indicators heading higher above their midlines, albeit lacking clear momentum at the time being. In the 4 hours chart the technical tone is also mild positive, and further gains are possible if 101.60 holds, yet a break below it exposes the pair to a slide towards 101.20 price zone.
Support levels: 101.60 101.20 100.70
Resistance levels: 101.95 102.35 102.80
AUD/USD Current price: 0.9372
View Live Chart for the AUD/USD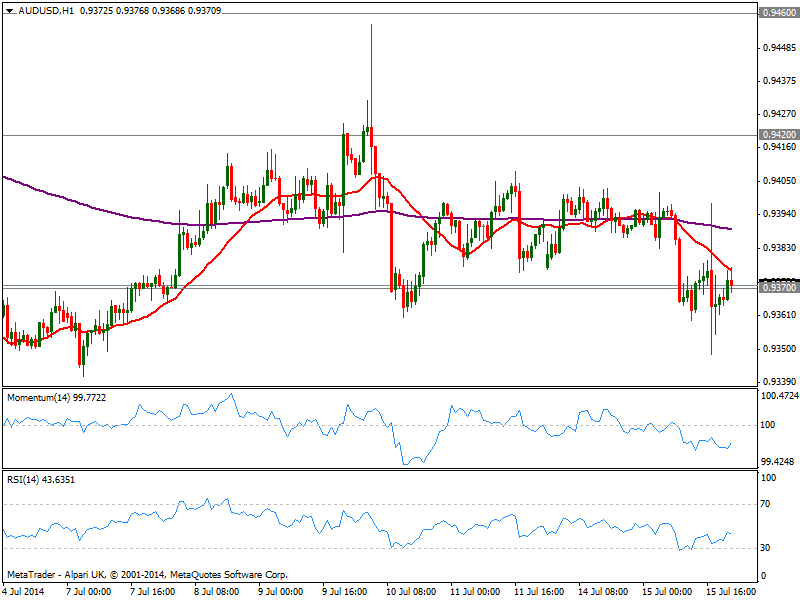
Australian dollar suffered a kneejerk against the dollar, down to 0.9348 on the day, thus quickly returned to 0.9370 strong static level. Technically, the short term outlook is bearish as per 20 SMA capping the upside and indicators heading slightly lower below their midlines. In the 4 hours chart indicators also head south below their midlines, with moving averages horizontal above current price, which reflects the lack of clear directional strength. Nevertheless, the downside is favored as long as below 0.9420, looking for a test of the 0.9330 strong static support zone.
Support levels: 0.9370 0.9330 0.9300
Resistance levels: 0.9420 0.9460 0.9500