![]() Nadia Simmons
Nadia Simmons
Sunshine Profits
On Tuesday, crude oil wavered between small gains and losses, but finally closed another day under the upper border of the short-term rising trend channel. Will this show of oil bulls’ weakness trigger further deterioration in the coming days? Will the relationship between black gold and oil stocks give us more clues about future moves?
Crude Oil’s Technical Picture
Before we answer this question, let’s examine the technical picture of crude oil (charts courtesy of http://stockcharts.com).
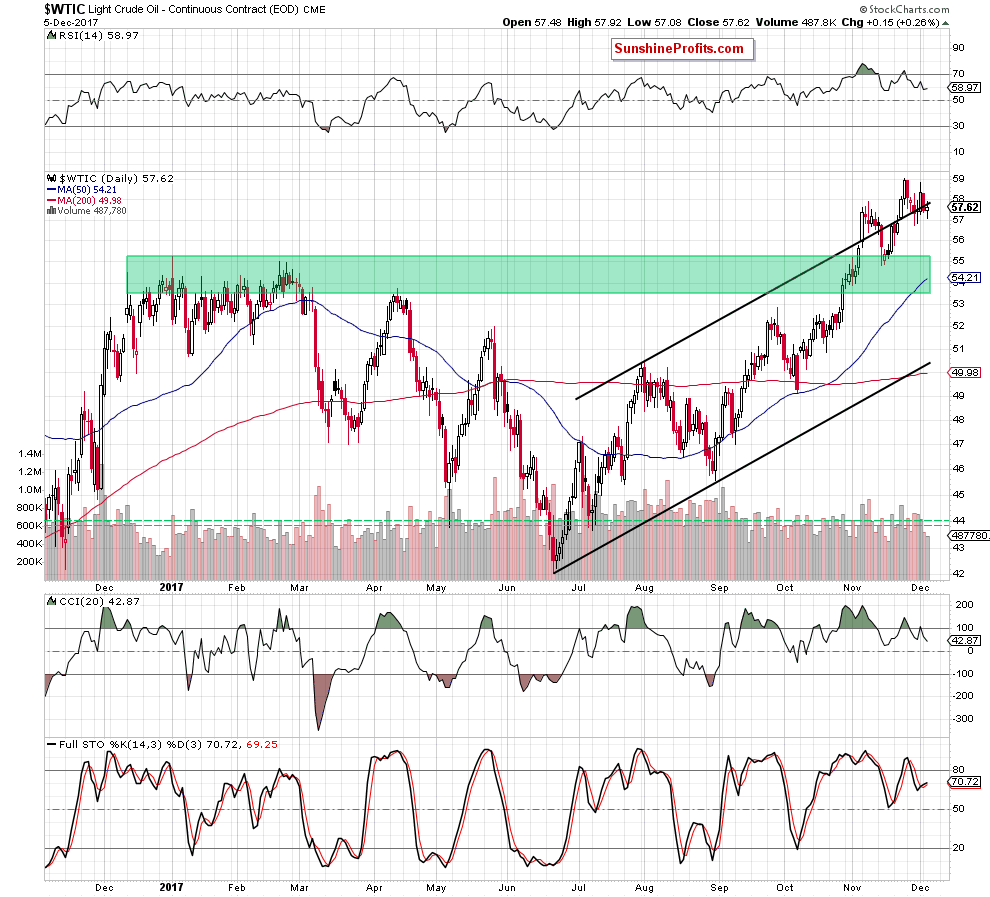
Looking at the daily chart, we see that although oil bulls managed to stop declines after the market open and triggered a rebound, black gold closed yesterday’s session under the upper border of the short-term rising trend channel. Such price action looks like a verification of the Monday breakdown, which doesn’t bode well for oil bulls and higher prices of black gold in the coming days.
Additionally, the size of volume, which accompanied yesterday “increase” was smaller than day earlier, which together with the sell signals generated by the RSI and the CCI suggests that the comeback of oil bears is just a matter of time (most likely a short period of time).
The pro bearish scenario is not only reinforced by the broader picture of crude oil and the bearish divergences between the WTIC:UDN and the price of crude oil priced in the U.S. dollars (we wrote more about these issues in our Monday Oil Trading Alert), but also by the current situation in the oil-to-oil stocks ratio.
Relationship between Crude Oil and Oil Stocks
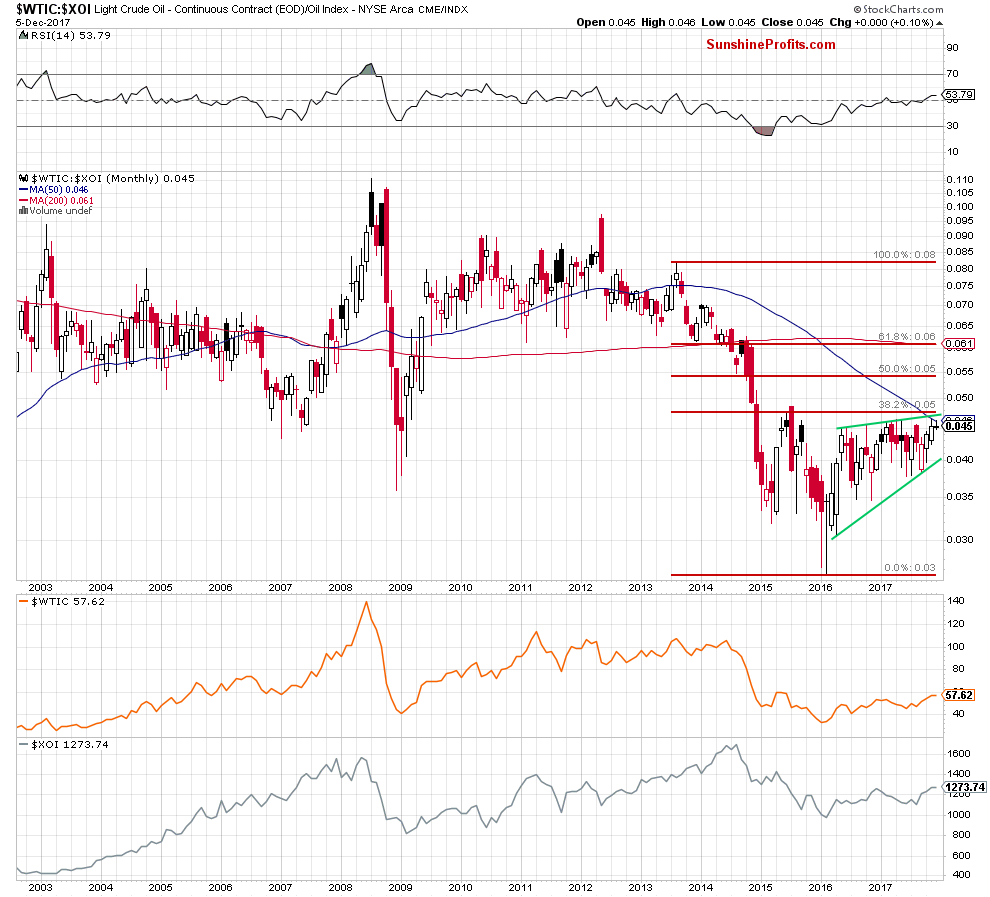
Looking at the monthly chart, we see that although the ratio increased in the previous month, the 50-month moving average together with the proximity to the upper border of the green rising wedge and the 38.2% Fibonacci retracement stopped the bulls, triggering a pullback. Earlier this month, we saw another unsuccessful attempt to move higher, which suggests that a bigger move to the downside may be just around the corner.
At this point, it is worth noting that we saw similar situations in June 2016 and March, April and May 2017. In all these cases, unsuccessful breakouts resulted in declines in the following month(s), which increases the probability that the history will repeat itself and we’ll see another downward move in the coming month.
Additionally, when we take a closer look at the medium-term chart, we’ll see that the ratio invalidated the earlier tiny breakout above the upper border of the red gap, the previous peaks and the blue dashed resistance line, which is a strong bearish development.
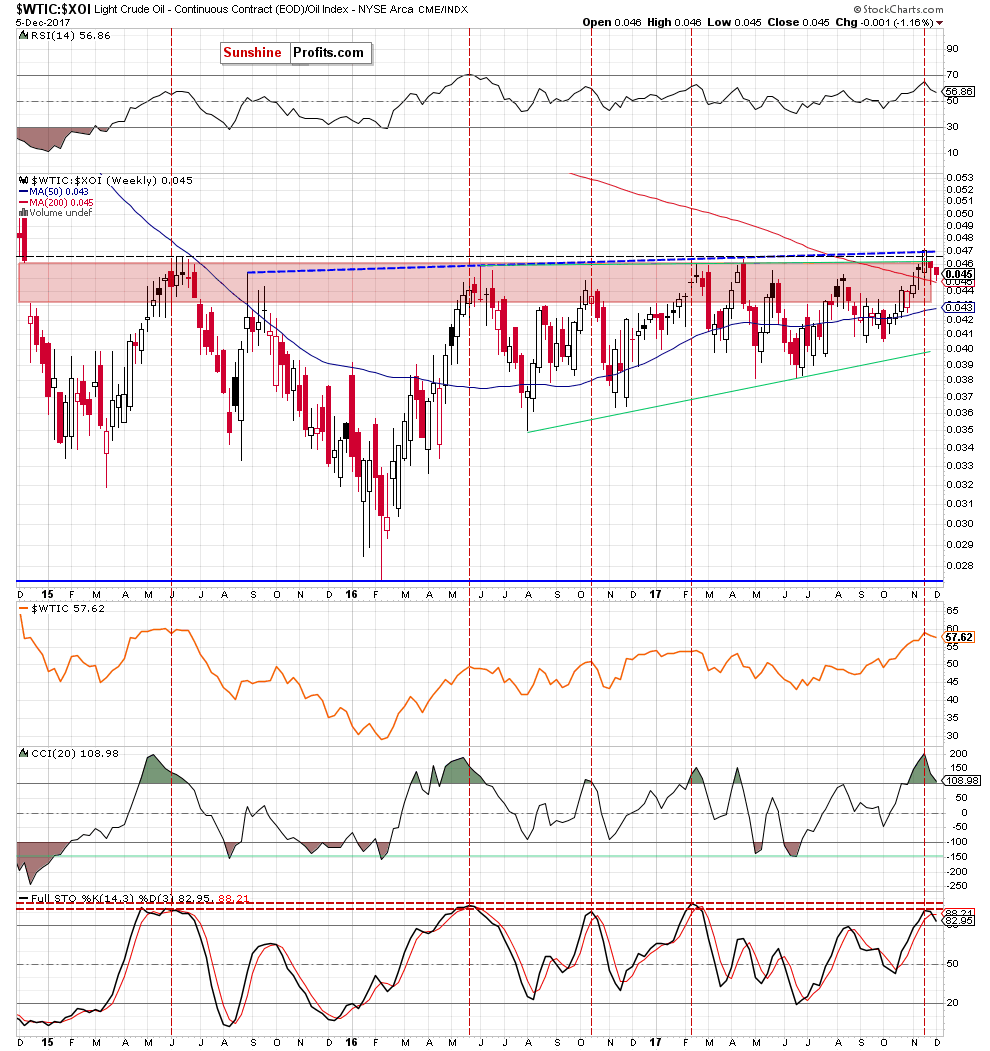
Why? As you see on the above chart, there were similar attempts to close the gap many times in the previous years, but they all failed, which encouraged the bears to act and trigger declines in the following weeks.
What does it mean for crude oil? Taking into account a positive correlation between the commodity and the ratio, we believe that declines in the latter case will also affect negatively the price of crude oil. If this is the case, we’ll see a realization of the bearish scenario from our Monday alert:
(…) How low could crude oil go if oil bears show their strength in the coming weeks? In our opinion, if light crude extends losses from current levels, we’ll see (at least) a drop to around $54.81-$55.24, where the January peak and the mid-November lows are. If this support area is broken, the way to lever levels will be open.
Summing up, short positions continue to be justified from the risk/reward perspective as crude oil verified the breakdown under the upper border of the black rising trend channel. The pro-bearish scenario is also reinforced by the current situation in the oil-to-oil stocks ratio, which increases the probability of further declines in the coming week(s).
All essays, research and information found above represent analyses and opinions of Przemyslaw Radomski, CFA and Sunshine Profits' employees and associates only. As such, it may prove wrong and be a subject to change without notice. Opinions and analyses were based on data available to authors of respective essays at the time of writing. Although the information provided above is based on careful research and sources that are believed to be accurate, Przemyslaw Radomski, CFA and his associates do not guarantee the accuracy or thoroughness of the data or information reported. The opinions published above are neither an offer nor a recommendation to purchase or sell any securities. Mr. Radomski is not a Registered Securities Advisor. By reading Przemyslaw Radomski's, CFA reports you fully agree that he will not be held responsible or liable for any decisions you make regarding any information provided in these reports. Investing, trading and speculation in any financial markets may involve high risk of loss. Przemyslaw Radomski, CFA, Sunshine Profits' employees and affiliates as well as members of their families may have a short or long position in any securities, including those mentioned in any of the reports or essays, and may make additional purchases and/or sales of those securities without notice.
Recommended Content
Editors’ Picks
EUR/USD edges lower toward 1.0700 post-US PCE

EUR/USD stays under modest bearish pressure but manages to hold above 1.0700 in the American session on Friday. The US Dollar (USD) gathers strength against its rivals after the stronger-than-forecast PCE inflation data, not allowing the pair to gain traction.
GBP/USD retreats to 1.2500 on renewed USD strength

GBP/USD lost its traction and turned negative on the day near 1.2500. Following the stronger-than-expected PCE inflation readings from the US, the USD stays resilient and makes it difficult for the pair to gather recovery momentum.
Gold struggles to hold above $2,350 following US inflation

Gold turned south and declined toward $2,340, erasing a large portion of its daily gains, as the USD benefited from PCE inflation data. The benchmark 10-year US yield, however, stays in negative territory and helps XAU/USD limit its losses.
Bitcoin Weekly Forecast: BTC’s next breakout could propel it to $80,000 Premium

Bitcoin’s recent price consolidation could be nearing its end as technical indicators and on-chain metrics suggest a potential upward breakout. However, this move would not be straightforward and could punish impatient investors.
Week ahead – Hawkish risk as Fed and NFP on tap, Eurozone data eyed too

Fed meets on Wednesday as US inflation stays elevated. Will Friday’s jobs report bring relief or more angst for the markets? Eurozone flash GDP and CPI numbers in focus for the Euro.