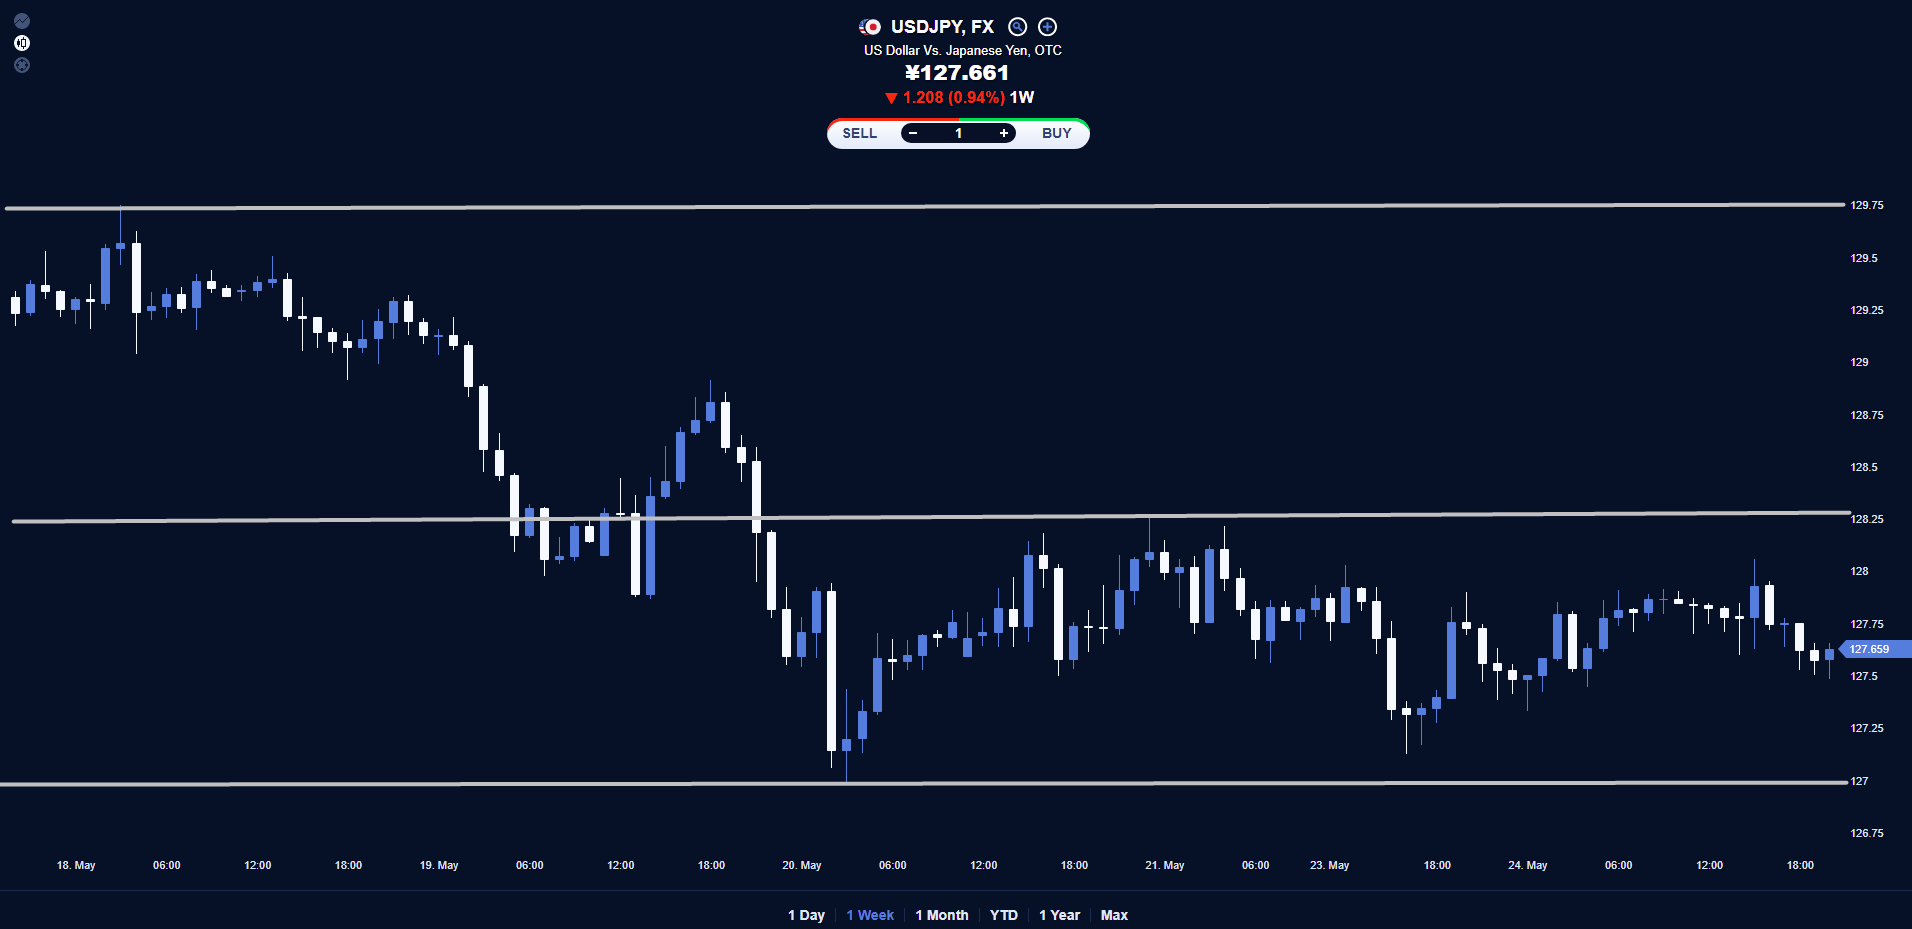
Could USD/JPY move towards the 128.25 level?

USD/JPY
Looking at USDJPY Chart, we can see the fall from the 129.5 range on the 16th of May to the 128.5 range on the 19th of May and then further below to the 127 level where it found support, leading to the bounce to the 128 where it has been trading since. It was last found trading at the 127.66 level having closest support at the 127 and closest overhead resistance found at the 128.25 level.
Today we can expect a move towards the 128.25 closest overhead resistance level as there is longer-term support around the 127 level.
However, if it doesn’t manage to keep consolidation, then a move towards the 127 level can be expected.
Author

AAATrade Team
AAATrade
The AAATrade Team has extensive experience in content writing for the financial industry. Stelios Nikolaou is the lead writer of the team, he currently works at AAATrade to provide research and content writing services.


